
Financial services company Triumph Financial (NASDAQ: TFIN) missed Wall Street’s revenue expectations in Q3 CY2025 as sales rose 3% year on year to $109.3 million. Its GAAP profit of $0.04 per share decreased from $0.19 in the same quarter last year.
Is now the time to buy Triumph Financial? Find out by accessing our full research report, it’s free for active Edge members.
Triumph Financial (TFIN) Q3 CY2025 Highlights:
- Net Interest Income: $87.83 million vs analyst estimates of $91.08 million (flat year on year, 3.6% miss)
- Net Interest Margin: 6.3% vs analyst estimates of 6.3% (3.7 basis point miss)
- Revenue: $109.3 million vs analyst estimates of $110.8 million (3% year-on-year growth, 1.4% miss)
- Tangible Book Value per Share: $19.70 vs analyst estimates of $19.45 (17.2% year-on-year decline, 1.3% beat)
- Market Capitalization: $1.15 billion
Company Overview
Originally focused on traditional banking before pivoting to serve the transportation sector, Triumph Financial (NASDAQ: TFIN) provides specialized financial services to the trucking industry, including payments processing, factoring, banking, and data intelligence solutions.
Sales Growth
Two primary revenue streams drive bank earnings. While net interest income, which is earned by charging higher rates on loans than paid on deposits, forms the foundation, fee-based services across banking, credit, wealth management, and trading operations provide additional income. Thankfully, Triumph Financial’s 6% annualized revenue growth over the last five years was decent. Its growth was slightly above the average banking company and shows its offerings resonate with customers.
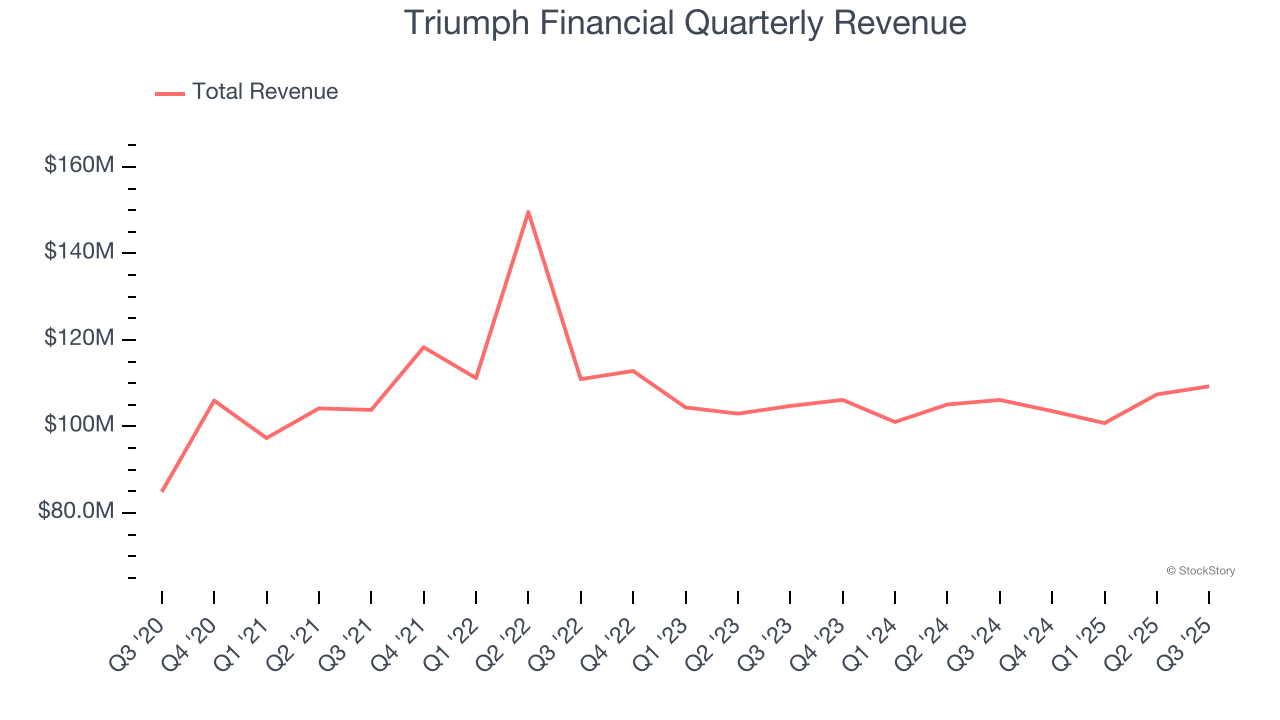
Long-term growth is the most important, but within financials, a half-decade historical view may miss recent interest rate changes and market returns. Triumph Financial’s recent performance shows its demand has slowed as its revenue was flat over the last two years. 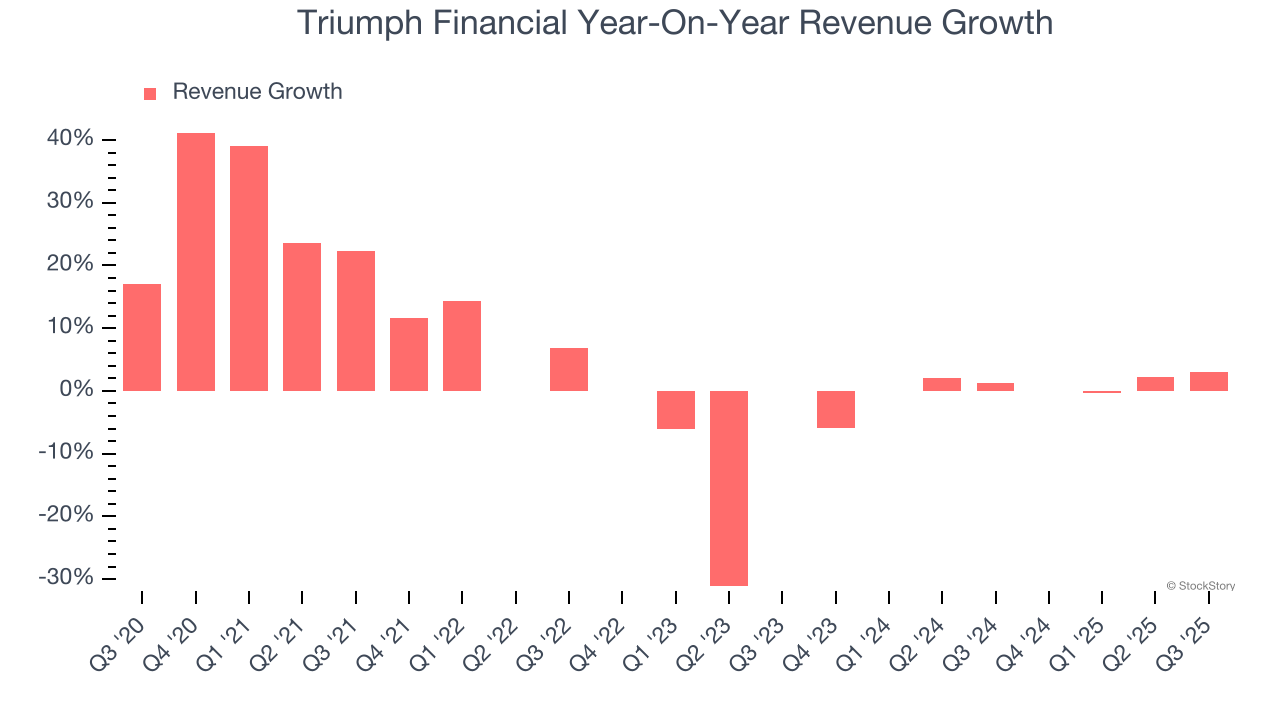 Note: Quarters not shown were determined to be outliers, impacted by outsized investment gains/losses that are not indicative of the recurring fundamentals of the business.
This quarter, Triumph Financial’s revenue grew by 3% year on year to $109.3 million, falling short of Wall Street’s estimates.
Net interest income made up 84.9% of the company’s total revenue during the last five years, meaning Triumph Financial barely relies on non-interest income to drive its overall growth.
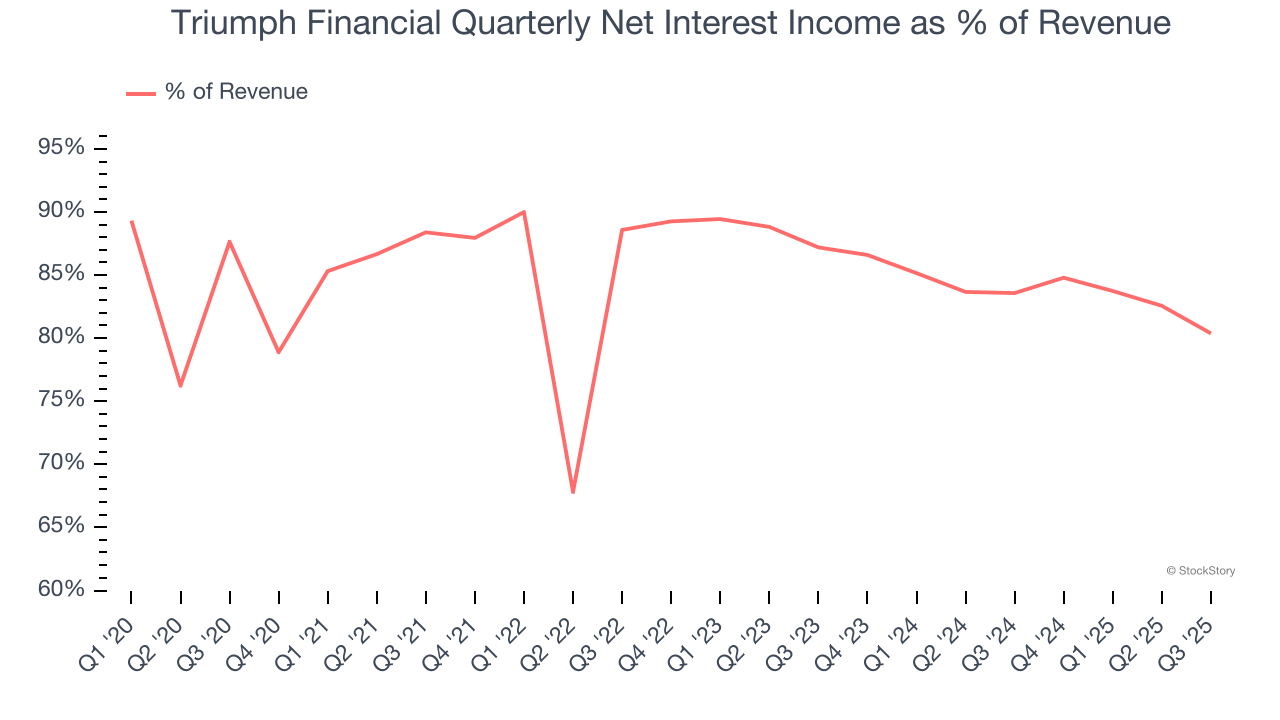
Net interest income commands greater market attention due to its reliability and consistency, whereas non-interest income is often seen as lower-quality revenue that lacks the same dependable characteristics.
Here at StockStory, we certainly understand the potential of thematic investing. Diverse winners from Microsoft (MSFT) to Alphabet (GOOG), Coca-Cola (KO) to Monster Beverage (MNST) could all have been identified as promising growth stories with a megatrend driving the growth. So, in that spirit, we’ve identified a relatively under-the-radar profitable growth stock benefiting from the rise of AI, available to you FREE via this link.
Tangible Book Value Per Share (TBVPS)
Banks operate as balance sheet businesses, with profits generated through borrowing and lending activities. Valuations reflect this reality, emphasizing balance sheet strength and long-term book value compounding ability.
This is why we consider tangible book value per share (TBVPS) the most important metric to track for banks. TBVPS represents the real, liquid net worth per share of a bank, excluding intangible assets that have debatable value upon liquidation. On the other hand, EPS is often distorted by mergers and flexible loan loss accounting. TBVPS provides clearer performance insights.
Triumph Financial’s TBVPS grew at a sluggish 1.2% annual clip over the last five years. On a two-year basis, however, dynamics have changed as TBVPS dropped by 8.5% annually ($23.54 to $19.70 per share).
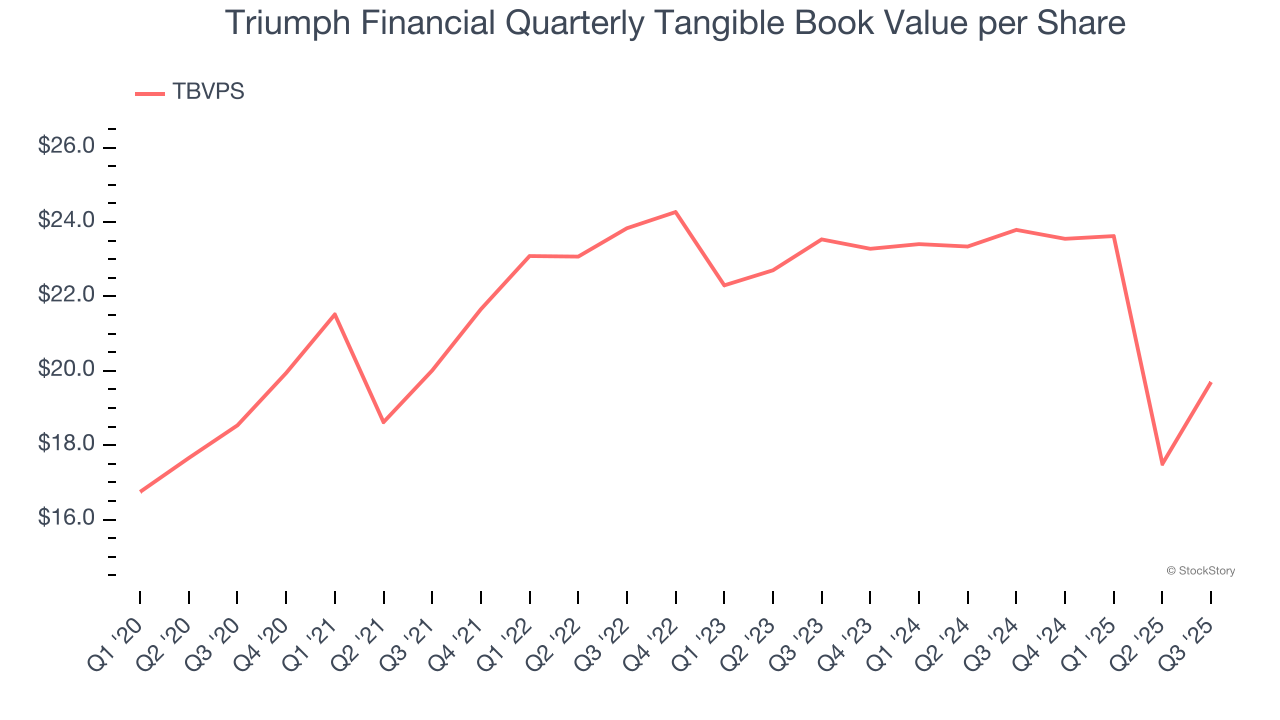
Over the next 12 months, Consensus estimates call for Triumph Financial’s TBVPS to grow by 11.8% to $22.02, top-notch growth rate.
Key Takeaways from Triumph Financial’s Q3 Results
It was good to see Triumph Financial narrowly top analysts’ tangible book value per share expectations this quarter. On the other hand, its net interest income missed and its revenue fell slightly short of Wall Street’s estimates. Overall, this was a weaker quarter. The stock traded down 2.9% to $46.53 immediately after reporting.
Triumph Financial’s earnings report left more to be desired. Let’s look forward to see if this quarter has created an opportunity to buy the stock. What happened in the latest quarter matters, but not as much as longer-term business quality and valuation, when deciding whether to invest in this stock. We cover that in our actionable full research report which you can read here, it’s free for active Edge members.


