
HCI Group trades at $190.34 and has moved in lockstep with the market. Its shares have returned 30.3% over the last six months while the S&P 500 has gained 25.5%.
Is now a good time to buy HCI? Find out in our full research report, it’s free for active Edge members.
Why Are We Positive On HCI?
Starting as a Florida "take-out" insurer that assumed policies from the state-backed Citizens Property Insurance Corporation, HCI Group (NYSE: HCI) provides property and casualty insurance, primarily homeowners coverage, while leveraging proprietary technology to improve underwriting and claims processing.
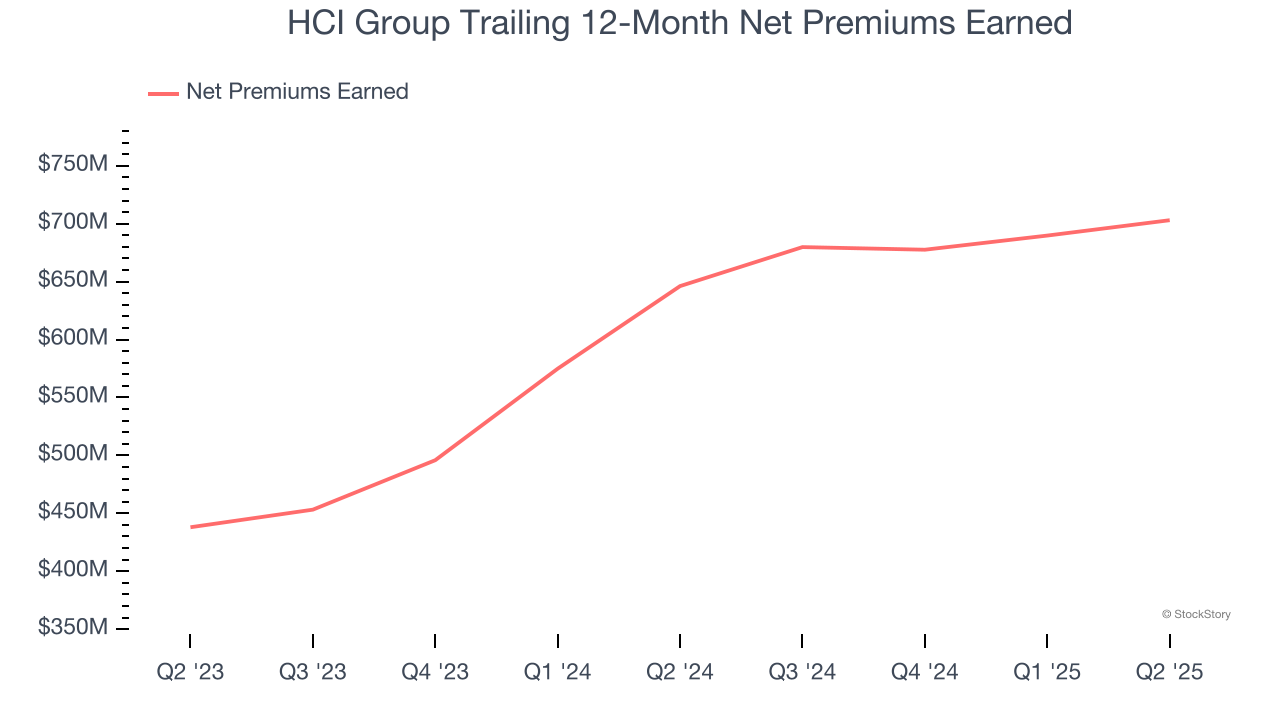
1. Net Premiums Earned Skyrocket, Fueling Growth Opportunities
When insurers sell policies, they protect themselves from extremely large losses or an outsized accumulation of losses with reinsurance (insurance for insurance companies). Net premiums earned are therefore net of what’s ceded to reinsurers as a risk mitigation and transfer strategy.
HCI Group’s net premiums earned has grown at a 26.7% annualized rate over the last two years, much better than the broader insurance industry and faster than its total revenue.
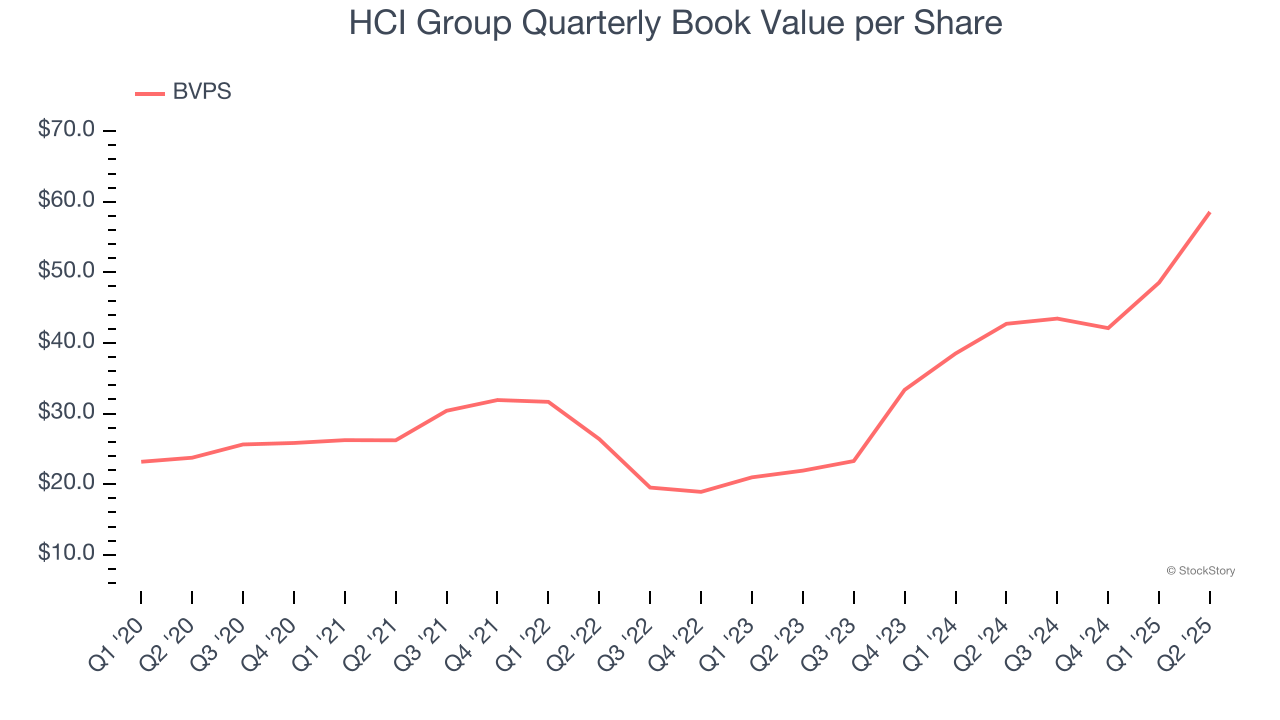
2. Growing BVPS Reflects Strong Asset Base
We consider book value per share (BVPS) a critical metric for insurance companies. BVPS represents the total net worth per share, providing insight into a company’s financial strength and ability to meet policyholder obligations.
HCI Group’s BVPS increased by 19.8% annually over the last five years, and growth has recently accelerated as BVPS grew at an incredible 63.4% annual clip over the past two years (from $21.92 to $58.55 per share).
3. Projected BVPS Growth Is Remarkable
Book value per share (BVPS) growth comes from an insurer’s ability to price risk appropriately and invest premiums profitably.
Over the next 12 months, Consensus estimates call for HCI Group’s BVPS to grow by 23% to $54.98, elite growth rate.

Final Judgment
These are just a few reasons why HCI Group is one of the best insurance companies out there, but at $190.34 per share (or 2.9× forward P/B), is now the right time to buy the stock? See for yourself in our comprehensive research report, it’s free for active Edge members .
High-Quality Stocks for All Market Conditions
Trump’s April 2025 tariff bombshell triggered a massive market selloff, but stocks have since staged an impressive recovery, leaving those who panic sold on the sidelines.
Take advantage of the rebound by checking out our Top 9 Market-Beating Stocks. This is a curated list of our High Quality stocks that have generated a market-beating return of 183% over the last five years (as of March 31st 2025).
Stocks that made our list in 2020 include now familiar names such as Nvidia (+1,545% between March 2020 and March 2025) as well as under-the-radar businesses like the once-micro-cap company Tecnoglass (+1,754% five-year return). Find your next big winner with StockStory today.
StockStory is growing and hiring equity analyst and marketing roles. Are you a 0 to 1 builder passionate about the markets and AI? See the open roles here.


