
Regional banking company BOK Financial (NASDAQ: BOKF) reported Q3 CY2025 results beating Wall Street’s revenue expectations, with sales up 5.8% year on year to $546.4 million. Its GAAP profit of $2.22 per share was 1.8% above analysts’ consensus estimates.
Is now the time to buy BOK Financial? Find out by accessing our full research report, it’s free for active Edge members.
BOK Financial (BOKF) Q3 CY2025 Highlights:
- Net Interest Income: $337.6 million vs analyst estimates of $339.5 million (9.6% year-on-year growth, 0.5% miss)
- Net Interest Margin: 2.9% vs analyst estimates of 2.8% (6.5 basis point beat)
- Revenue: $546.4 million vs analyst estimates of $539.2 million (5.8% year-on-year growth, 1.3% beat)
- Efficiency Ratio: 66.7% vs analyst estimates of 66% (67.2 basis point miss)
- EPS (GAAP): $2.22 vs analyst estimates of $2.18 (1.8% beat)
- Tangible Book Value per Share: $78.11 vs analyst estimates of $77.34 (10.9% year-on-year growth, 1% beat)
- Market Capitalization: $6.99 billion
Company Overview
Tracing its roots back to 1910 when Oklahoma was still a young state, BOK Financial (NASDAQ: BOKF) is a regional bank holding company that provides commercial banking, consumer banking, and wealth management services across eight states in the central and southwestern US.
Sales Growth
From lending activities to service fees, most banks build their revenue model around two income sources. Interest rate spreads between loans and deposits create the first stream, with the second coming from charges on everything from basic bank accounts to complex investment banking transactions. Unfortunately, BOK Financial’s 2.1% annualized revenue growth over the last five years was tepid. This fell short of our benchmarks and is a tough starting point for our analysis.
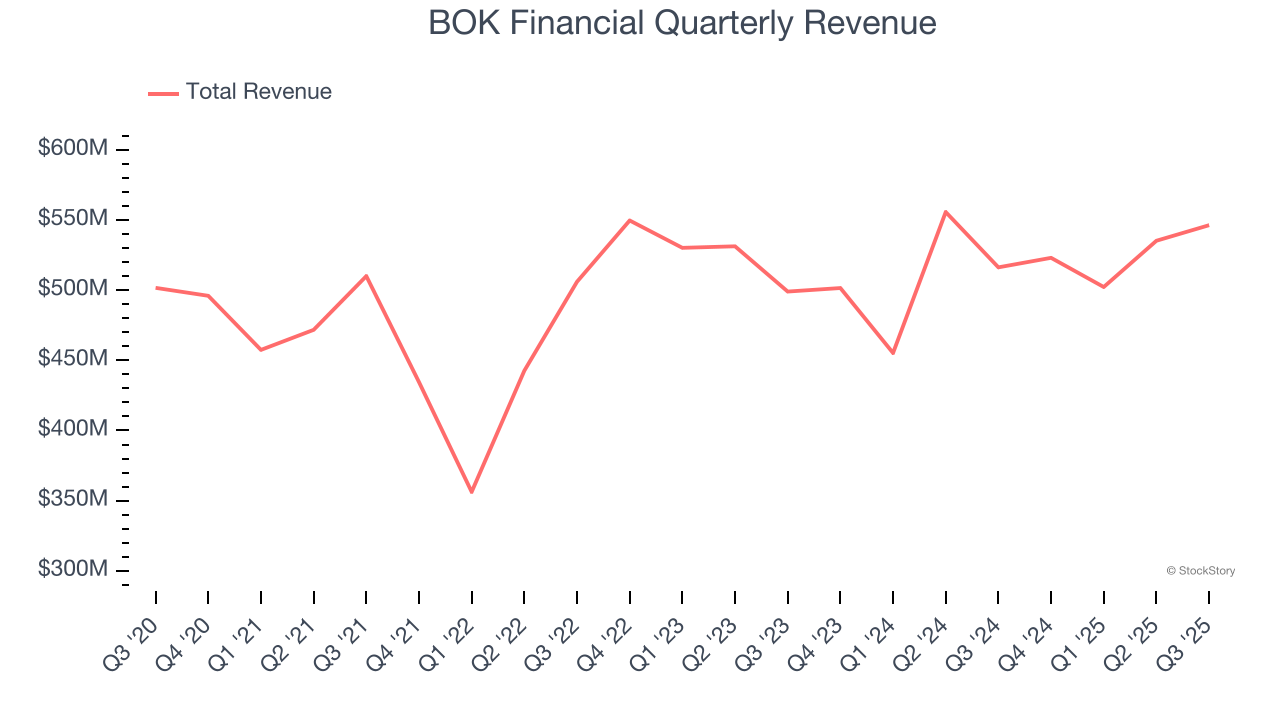
Long-term growth is the most important, but within financials, a half-decade historical view may miss recent interest rate changes and market returns. BOK Financial’s recent performance shows its demand has slowed as its revenue was flat over the last two years. 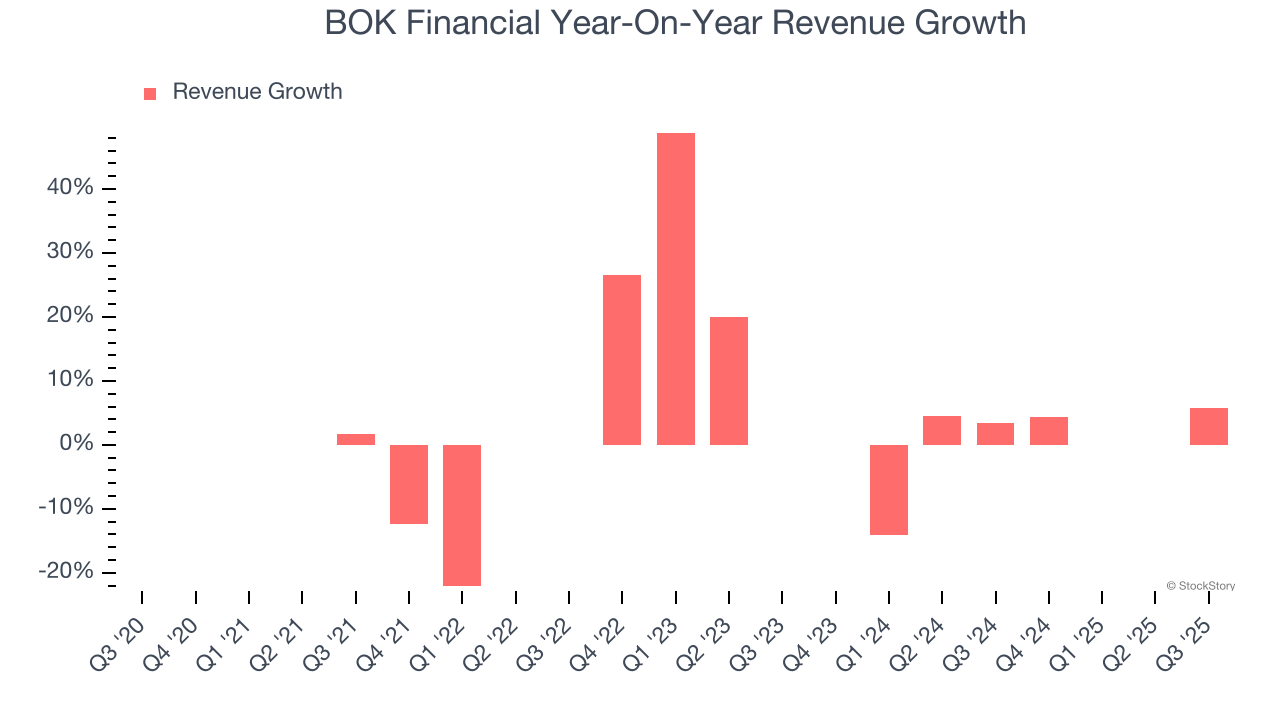 Note: Quarters not shown were determined to be outliers, impacted by outsized investment gains/losses that are not indicative of the recurring fundamentals of the business.
This quarter, BOK Financial reported year-on-year revenue growth of 5.8%, and its $546.4 million of revenue exceeded Wall Street’s estimates by 1.3%.
Net interest income made up 61.7% of the company’s total revenue during the last five years, meaning lending operations are BOK Financial’s largest source of revenue.
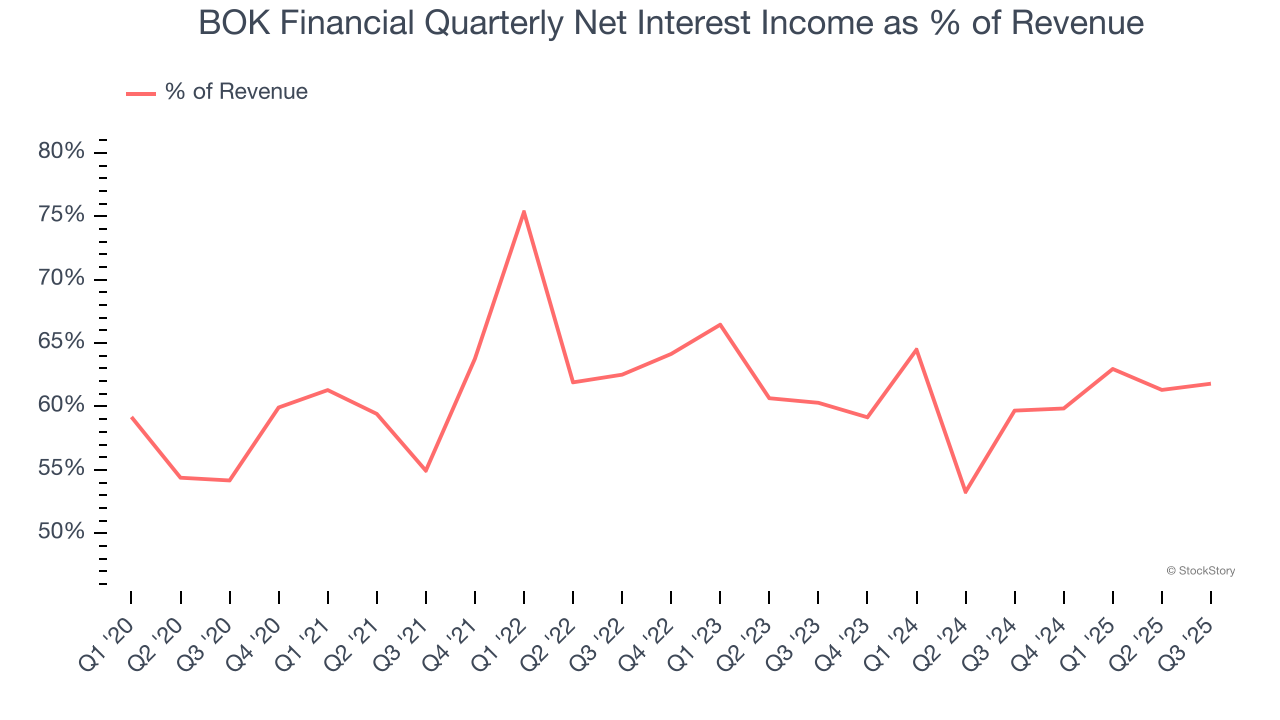
Markets consistently prioritize net interest income growth over fee-based revenue, recognizing its superior quality and recurring nature compared to the more unpredictable non-interest income streams.
Today’s young investors won’t have read the timeless lessons in Gorilla Game: Picking Winners In High Technology because it was written more than 20 years ago when Microsoft and Apple were first establishing their supremacy. But if we apply the same principles, then enterprise software stocks leveraging their own generative AI capabilities may well be the Gorillas of the future. So, in that spirit, we are excited to present our Special Free Report on a profitable, fast-growing enterprise software stock that is already riding the automation wave and looking to catch the generative AI next.
Tangible Book Value Per Share (TBVPS)
Banks profit by intermediating between depositors and borrowers, making them fundamentally balance sheet-driven enterprises. Market participants emphasize balance sheet quality and sustained book value growth when evaluating these institutions.
When analyzing banks, tangible book value per share (TBVPS) takes precedence over many other metrics. This measure isolates genuine per-share value by removing intangible assets of debatable liquidation worth. On the other hand, EPS is often distorted by mergers and flexible loan loss accounting. TBVPS provides clearer performance insights.
BOK Financial’s TBVPS grew at a solid 6.3% annual clip over the last five years. TBVPS growth has also accelerated recently, growing by 17.7% annually over the last two years from $56.40 to $78.11 per share.
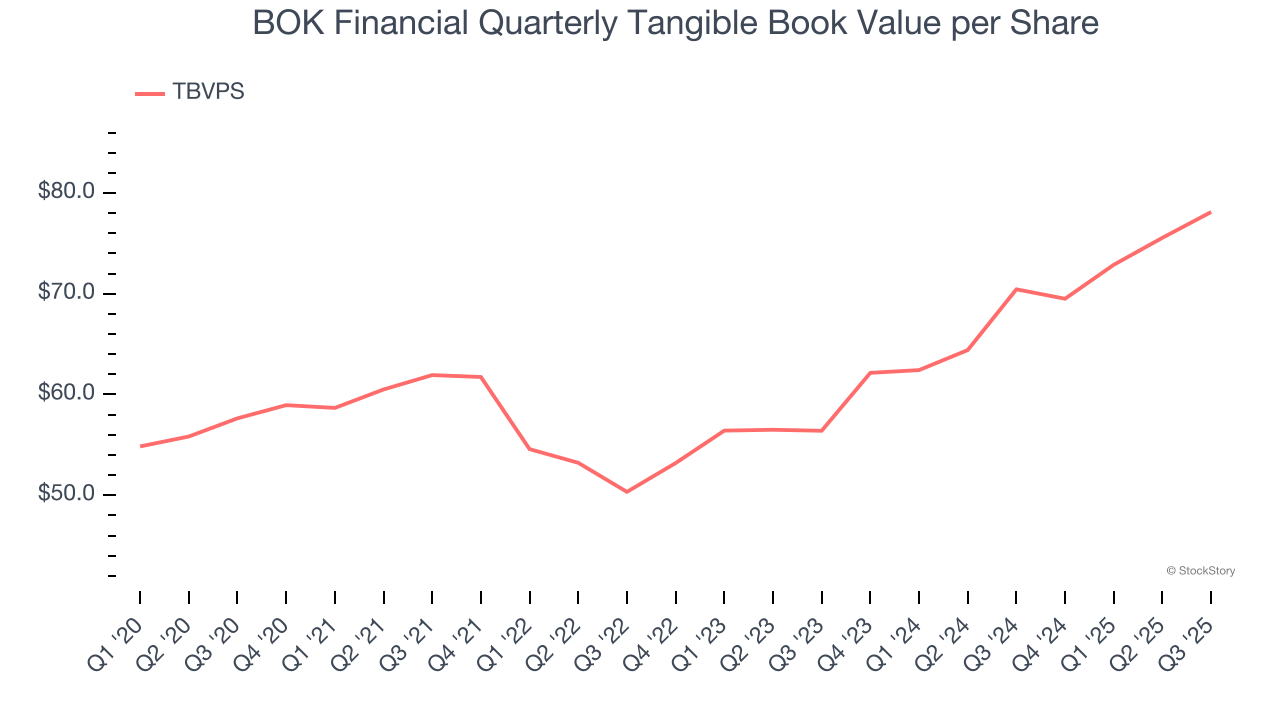
Over the next 12 months, Consensus estimates call for BOK Financial’s TBVPS to grow by 7.9% to $84.30, decent growth rate.
Key Takeaways from BOK Financial’s Q3 Results
It was good to see BOK Financial narrowly top analysts’ revenue expectations this quarter. We were also happy its tangible book value per share narrowly outperformed Wall Street’s estimates. On the other hand, its EPS slightly beat and its net interest income fell slightly short of Wall Street’s estimates. Overall, this was a weaker quarter. The stock remained flat at $110 immediately following the results.
Should you buy the stock or not? If you’re making that decision, you should consider the bigger picture of valuation, business qualities, as well as the latest earnings. We cover that in our actionable full research report which you can read here, it’s free for active Edge members.