
Regional banking company Cadence Bank (NYSE: CADE) fell short of the market’s revenue expectations in Q3 CY2025, but sales rose 14.7% year on year to $517.2 million. Its non-GAAP profit of $0.81 per share was 4.6% above analysts’ consensus estimates.
Is now the time to buy Cadence Bank? Find out by accessing our full research report, it’s free for active Edge members.
Cadence Bank (CADE) Q3 CY2025 Highlights:
- Net Interest Income: $423.7 million vs analyst estimates of $423.9 million (17.2% year-on-year growth, in line)
- Net Interest Margin: 3.5% vs analyst estimates of 3.4% (2.9 basis point beat)
- Revenue: $517.2 million vs analyst estimates of $522.5 million (14.7% year-on-year growth, 1% miss)
- Efficiency Ratio: 56.5% vs analyst estimates of 56.6% (12.9 basis point beat)
- Adjusted EPS: $0.81 vs analyst estimates of $0.77 (4.6% beat)
- Tangible Book Value per Share: $22.82 vs analyst estimates of $21.70 (5.3% year-on-year growth, 5.2% beat)
- Market Capitalization: $6.81 billion
Company Overview
With roots dating back to 1885 and a strategic focus on middle-market commercial lending, Cadence Bancorporation (NYSE: CADE) is a bank holding company that provides commercial banking, retail banking, and wealth management services to middle-market businesses and individuals.
Sales Growth
Two primary revenue streams drive bank earnings. While net interest income, which is earned by charging higher rates on loans than paid on deposits, forms the foundation, fee-based services across banking, credit, wealth management, and trading operations provide additional income. Over the last five years, Cadence Bank grew its revenue at an exceptional 13.1% compounded annual growth rate. Its growth beat the average banking company and shows its offerings resonate with customers, a helpful starting point for our analysis.
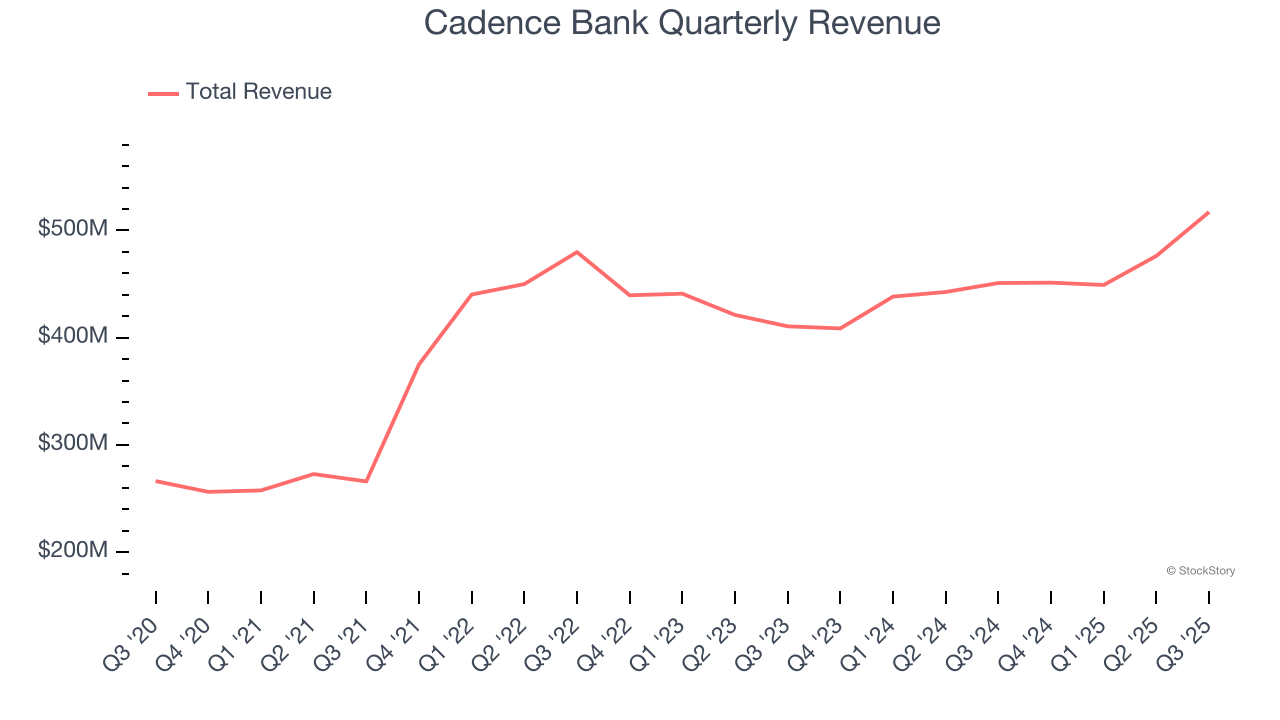
Long-term growth is the most important, but within financials, a half-decade historical view may miss recent interest rate changes and market returns. Cadence Bank’s annualized revenue growth of 5.2% over the last two years is below its five-year trend, but we still think the results were respectable. 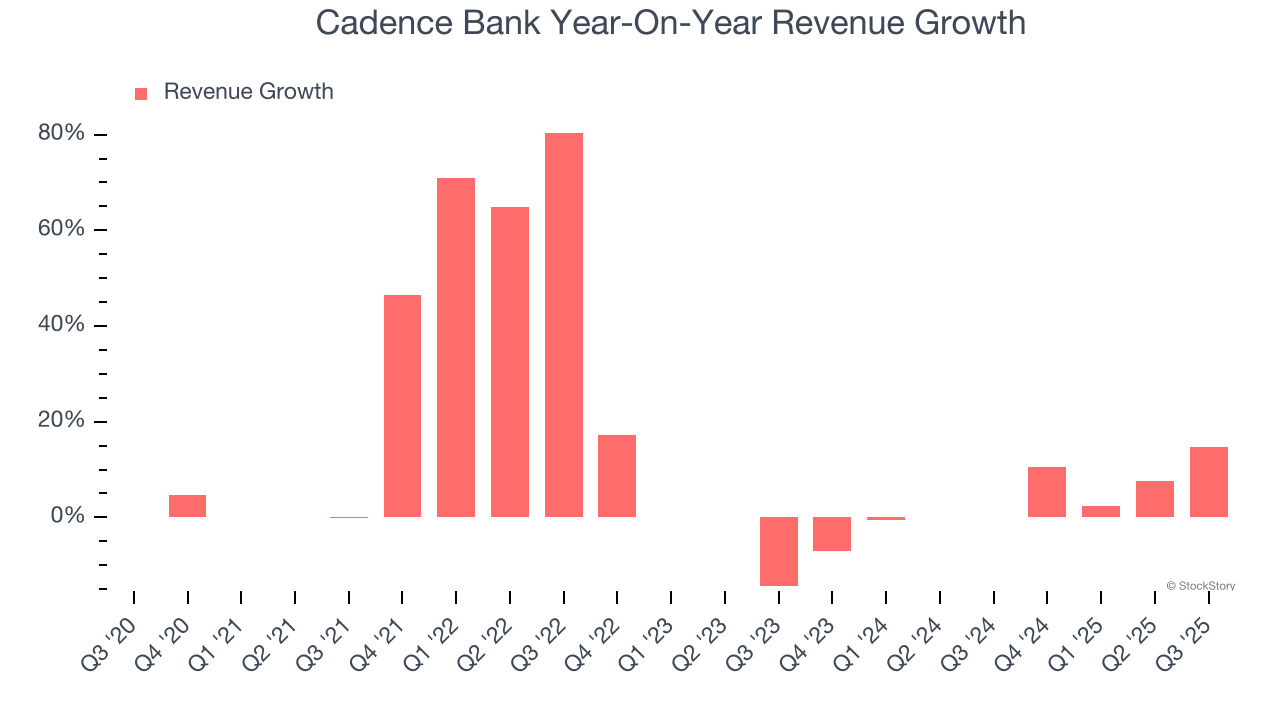 Note: Quarters not shown were determined to be outliers, impacted by outsized investment gains/losses that are not indicative of the recurring fundamentals of the business.
This quarter, Cadence Bank’s revenue grew by 14.7% year on year to $517.2 million but fell short of Wall Street’s estimates.
Net interest income made up 75.8% of the company’s total revenue during the last five years, meaning lending operations are Cadence Bank’s largest source of revenue.
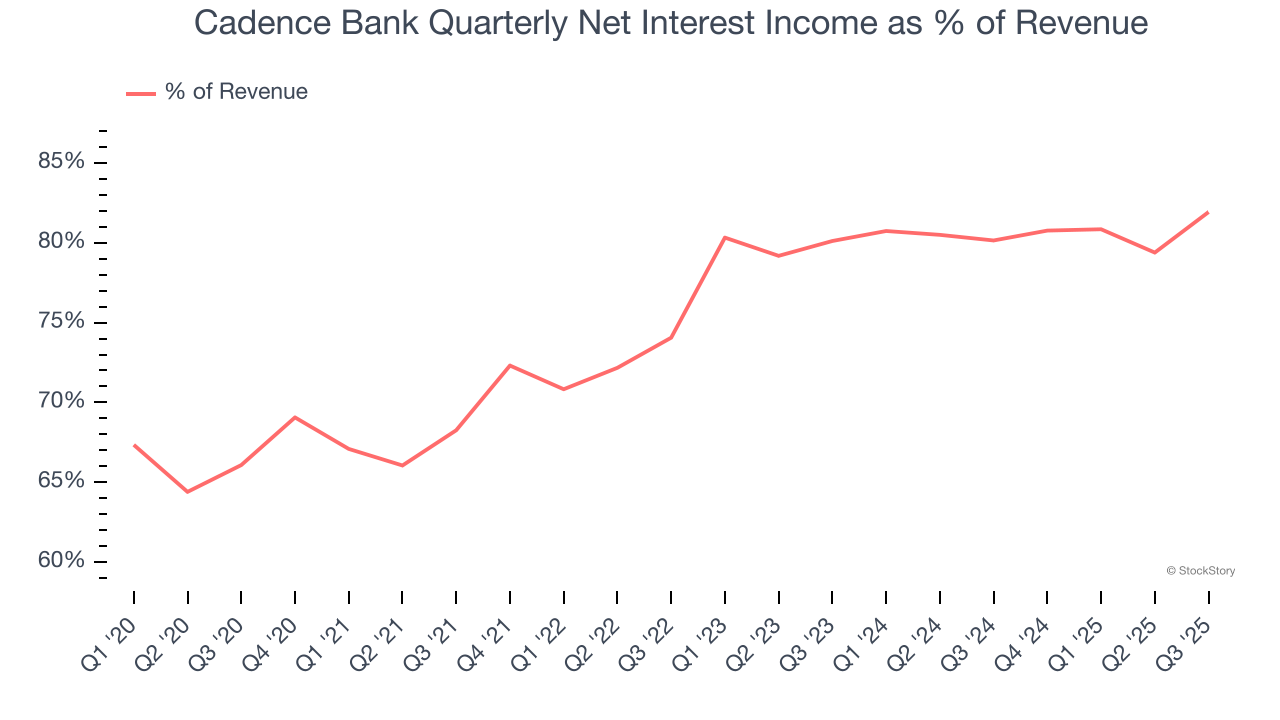
Markets consistently prioritize net interest income growth over fee-based revenue, recognizing its superior quality and recurring nature compared to the more unpredictable non-interest income streams.
Software is eating the world and there is virtually no industry left that has been untouched by it. That drives increasing demand for tools helping software developers do their jobs, whether it be monitoring critical cloud infrastructure, integrating audio and video functionality, or ensuring smooth content streaming. Click here to access a free report on our 3 favorite stocks to play this generational megatrend.
Tangible Book Value Per Share (TBVPS)
Banks operate as balance sheet businesses, with profits generated through borrowing and lending activities. Valuations reflect this reality, emphasizing balance sheet strength and long-term book value compounding ability.
When analyzing banks, tangible book value per share (TBVPS) takes precedence over many other metrics. This measure isolates genuine per-share value by removing intangible assets of debatable liquidation worth. On the other hand, EPS is often distorted by mergers and flexible loan loss accounting. TBVPS provides clearer performance insights.
Cadence Bank’s TBVPS grew at a solid 6.4% annual clip over the last five years. TBVPS growth has also accelerated recently, growing by 25.3% annually over the last two years from $14.54 to $22.82 per share.
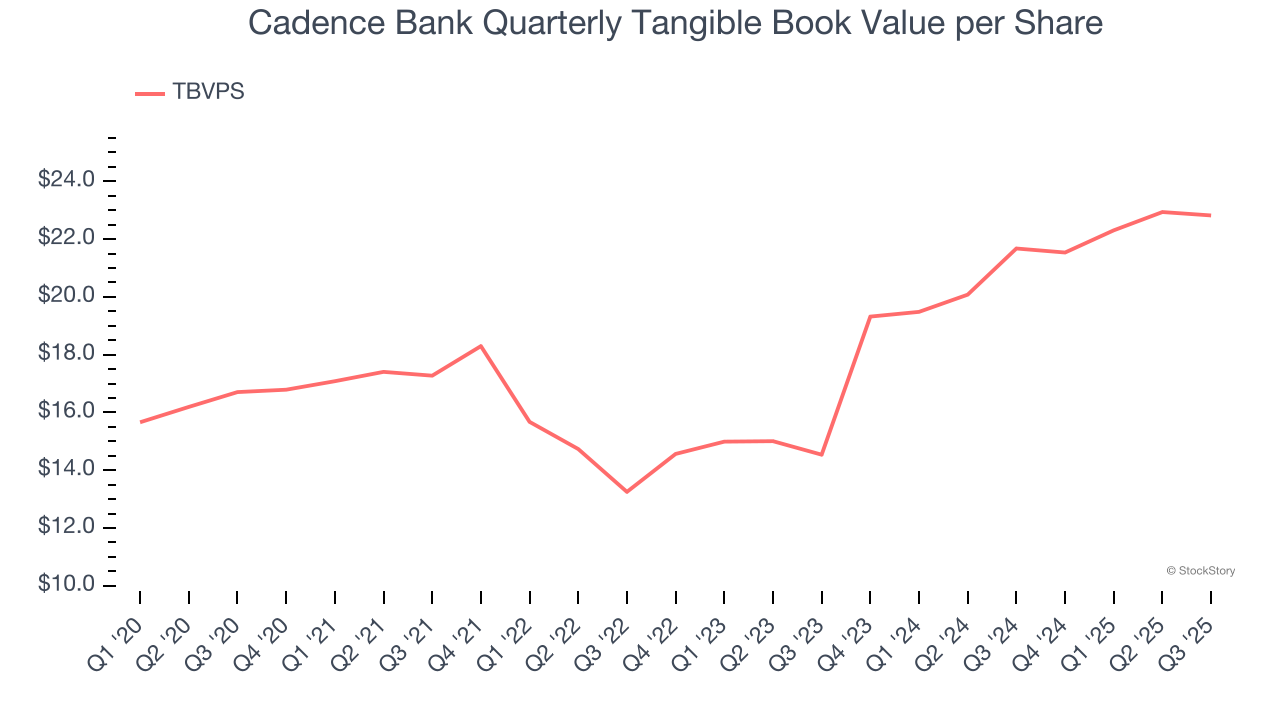
Over the next 12 months, Consensus estimates call for Cadence Bank’s TBVPS to grow by 6.6% to $24.32, mediocre growth rate.
Key Takeaways from Cadence Bank’s Q3 Results
We were impressed by how significantly Cadence Bank beat analysts’ tangible book value per share expectations this quarter. On the other hand, its revenue slightly missed on in line net interest income. Zooming out, we think this was a mixed quarter. The market seemed to be hoping for more, and the stock traded down 2.3% to $36.16 immediately following the results.
Is Cadence Bank an attractive investment opportunity at the current price? If you’re making that decision, you should consider the bigger picture of valuation, business qualities, as well as the latest earnings. We cover that in our actionable full research report which you can read here, it’s free for active Edge members.


