
Cross-border banking company East West Bancorp (NASDAQ: EWBC) announced better-than-expected revenue in Q3 CY2025, with sales up 18.3% year on year to $778 million. Its GAAP profit of $2.65 per share was 12.3% above analysts’ consensus estimates.
Is now the time to buy East West Bank? Find out by accessing our full research report, it’s free for active Edge members.
East West Bank (EWBC) Q3 CY2025 Highlights:
- Net Interest Income: $677.5 million vs analyst estimates of $634.5 million (18.3% year-on-year growth, 6.8% beat)
- Net Interest Margin: 3.5% vs analyst estimates of 3.4% (17.8 basis point beat)
- Revenue: $778 million vs analyst estimates of $726.7 million (18.3% year-on-year growth, 7.1% beat)
- Efficiency Ratio: 35.6% vs analyst estimates of 36.2% (64.2 basis point beat)
- EPS (GAAP): $2.65 vs analyst estimates of $2.36 (12.3% beat)
- Tangible Book Value per Share: $58.97 vs analyst estimates of $57.72 (13.5% year-on-year growth, 2.2% beat)
- Market Capitalization: $13.55 billion
Company Overview
As the largest independent bank in the U.S. focused on bridging financial services between America and Asia, East West Bancorp (NASDAQ: EWBC) operates a commercial bank that provides personal and business banking services with a unique focus on facilitating U.S.-Asia cross-border transactions.
Sales Growth
In general, banks make money from two primary sources. The first is net interest income, which is interest earned on loans, mortgages, and investments in securities minus interest paid out on deposits. The second source is non-interest income, which can come from bank account, credit card, wealth management, investing banking, and trading fees. Thankfully, East West Bank’s 11.7% annualized revenue growth over the last five years was excellent. Its growth beat the average banking company and shows its offerings resonate with customers, a helpful starting point for our analysis.
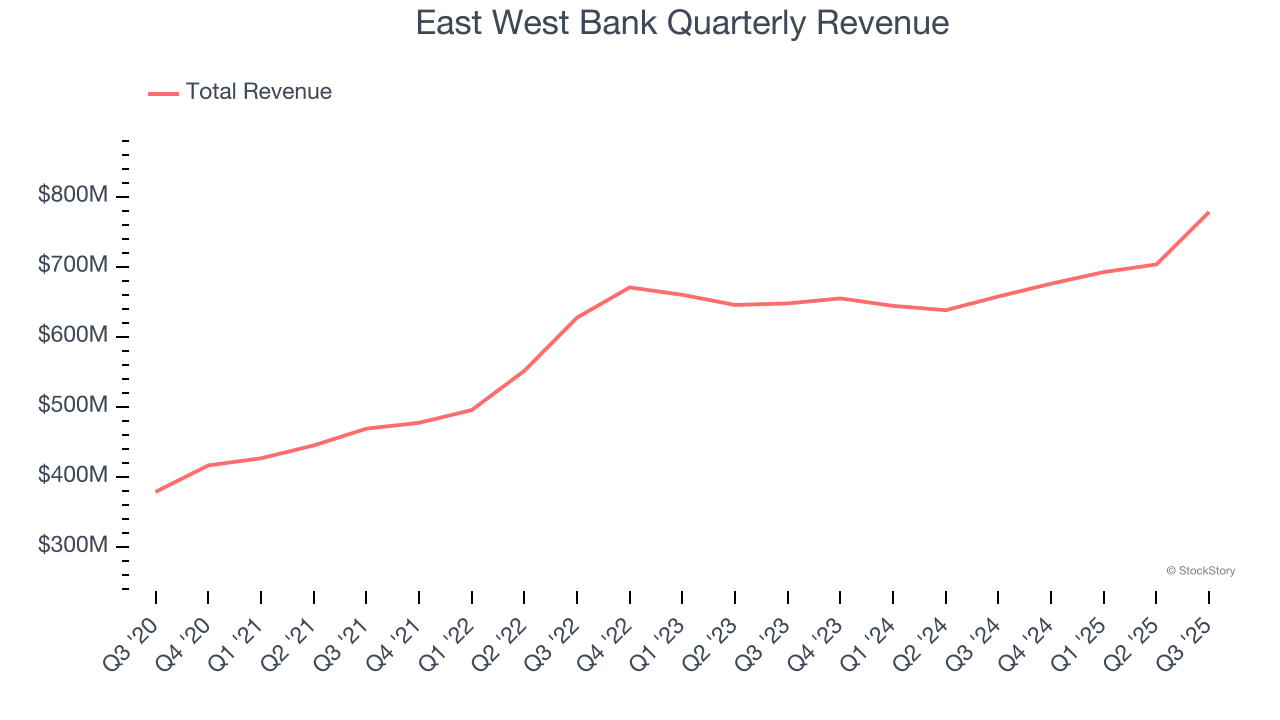
Long-term growth is the most important, but within financials, a half-decade historical view may miss recent interest rate changes and market returns. East West Bank’s recent performance shows its demand has slowed significantly as its annualized revenue growth of 4.2% over the last two years was well below its five-year trend. 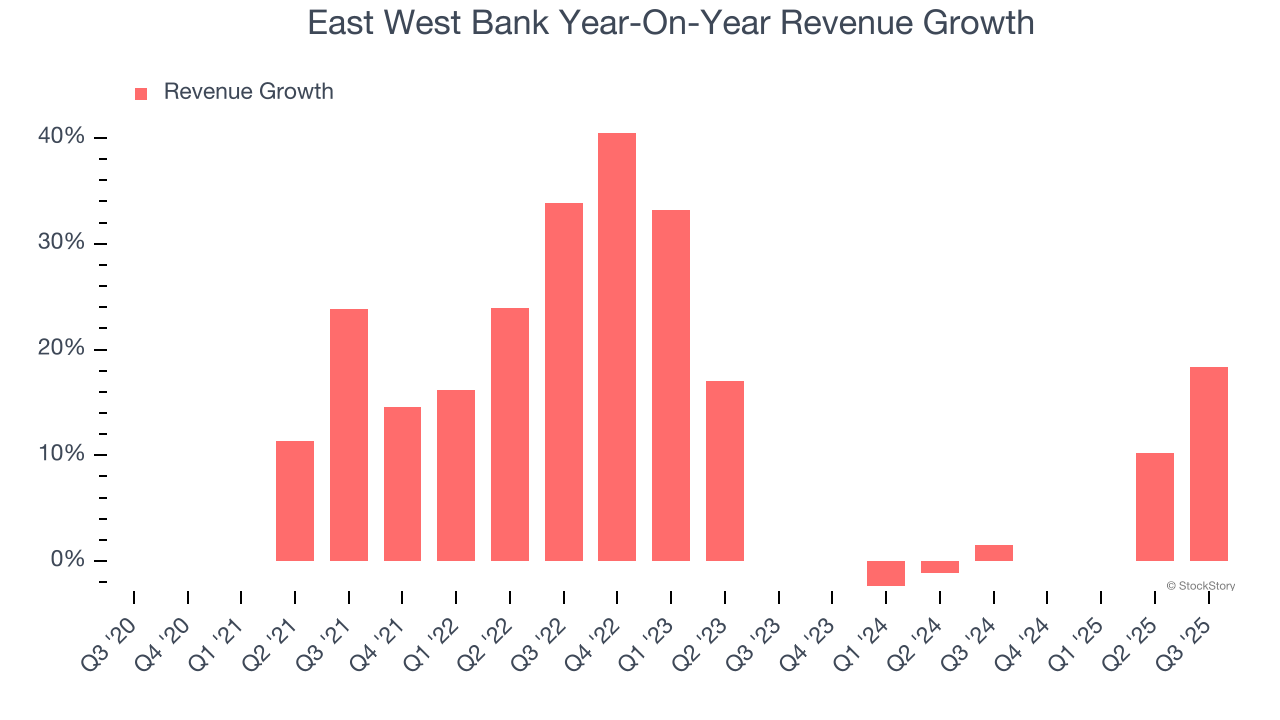 Note: Quarters not shown were determined to be outliers, impacted by outsized investment gains/losses that are not indicative of the recurring fundamentals of the business.
This quarter, East West Bank reported year-on-year revenue growth of 18.3%, and its $778 million of revenue exceeded Wall Street’s estimates by 7.1%.
Net interest income made up 86.3% of the company’s total revenue during the last five years, meaning East West Bank barely relies on non-interest income to drive its overall growth.
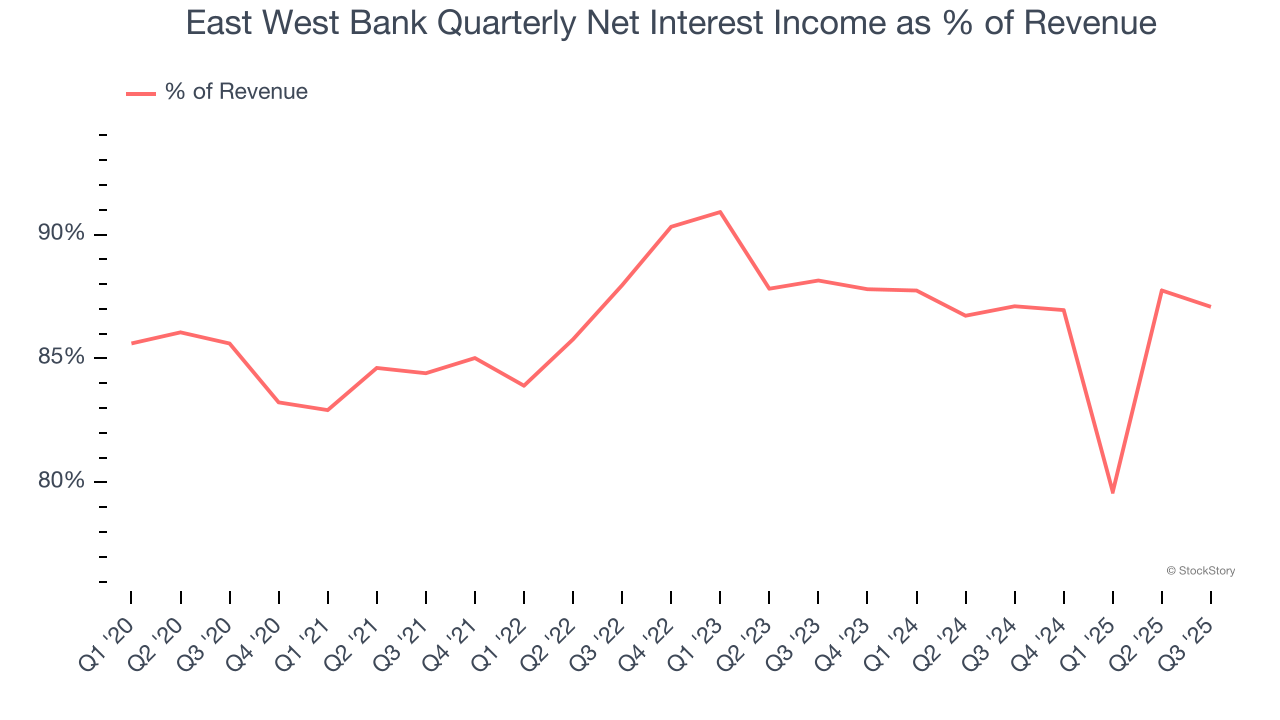
Our experience and research show the market cares primarily about a bank’s net interest income growth as non-interest income is considered a lower-quality and non-recurring revenue source.
Unless you’ve been living under a rock, it should be obvious by now that generative AI is going to have a huge impact on how large corporations do business. While Nvidia and AMD are trading close to all-time highs, we prefer a lesser-known (but still profitable) stock benefiting from the rise of AI. Click here to access our free report one of our favorites growth stories.
Tangible Book Value Per Share (TBVPS)
The balance sheet drives banking profitability since earnings flow from the spread between borrowing and lending rates. As such, valuations for these companies concentrate on capital strength and sustainable equity accumulation potential.
When analyzing banks, tangible book value per share (TBVPS) takes precedence over many other metrics. This measure isolates genuine per-share value by removing intangible assets of debatable liquidation worth. Other (and more commonly known) per-share metrics like EPS can sometimes be murky due to M&A or accounting rules allowing for loan losses to be spread out.
East West Bank’s TBVPS grew at an incredible 12.4% annual clip over the last five years. TBVPS growth has also accelerated recently, growing by 16.7% annually over the last two years from $43.33 to $58.97 per share.
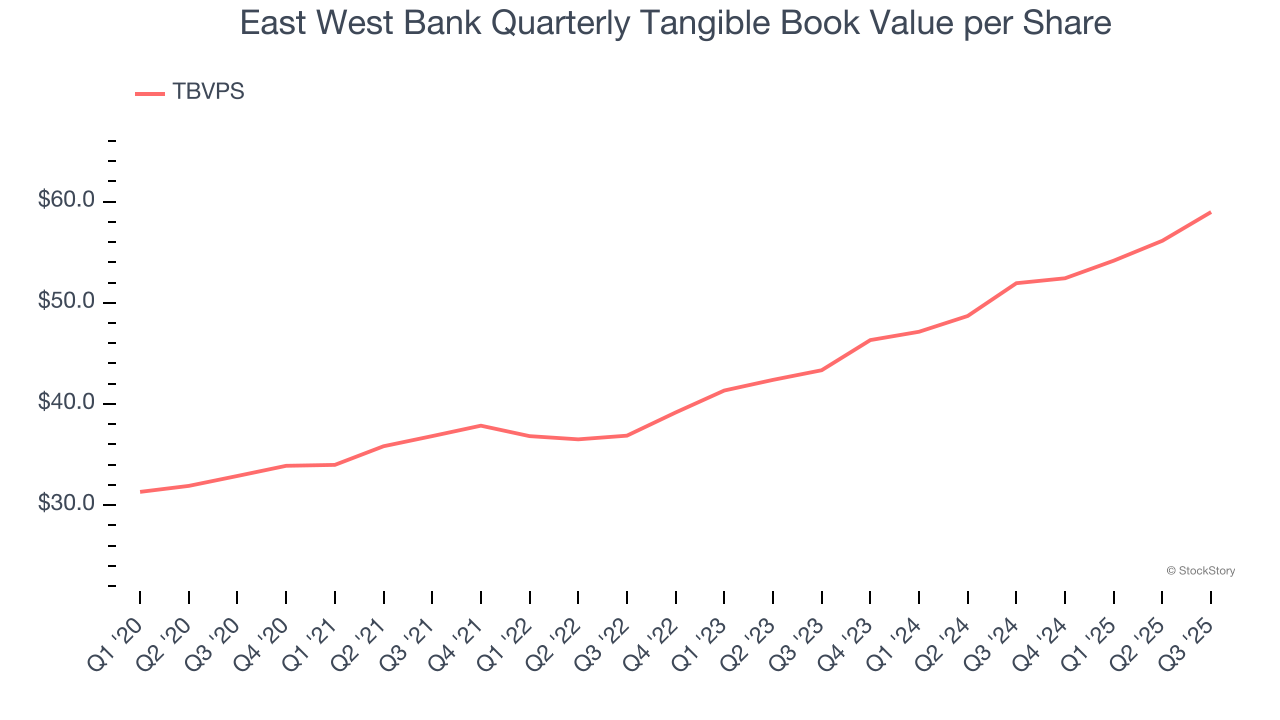
Over the next 12 months, Consensus estimates call for East West Bank’s TBVPS to grow by 10.1% to $64.92, solid growth rate.
Key Takeaways from East West Bank’s Q3 Results
We were impressed by how significantly East West Bank blew past analysts’ net interest income expectations this quarter. We were also excited its revenue outperformed Wall Street’s estimates by a wide margin. Zooming out, we think this quarter featured some important positives. The stock traded up 1.2% to $100 immediately after reporting.
East West Bank put up rock-solid earnings, but one quarter doesn’t necessarily make the stock a buy. Let’s see if this is a good investment. What happened in the latest quarter matters, but not as much as longer-term business quality and valuation, when deciding whether to invest in this stock. We cover that in our actionable full research report which you can read here, it’s free for active Edge members.