
Regional banking company Fulton Financial (NASDAQ: FULT) announced better-than-expected revenue in Q3 CY2025, with sales up 6.7% year on year to $338.9 million. Its GAAP profit of $1.62 per share was significantly above analysts’ consensus estimates.
Is now the time to buy Fulton Financial? Find out by accessing our full research report, it’s free for active Edge members.
Fulton Financial (FULT) Q3 CY2025 Highlights:
- Net Interest Income: $264.2 million vs analyst estimates of $262.3 million (2.4% year-on-year growth, 0.7% beat)
- Net Interest Margin: 3.6% vs analyst estimates of 3.5% (9 basis point beat)
- Revenue: $338.9 million vs analyst estimates of $328.5 million (6.7% year-on-year growth, 3.2% beat)
- Efficiency Ratio: 56.5% vs analyst estimates of 59.4% (292 basis point beat)
- EPS (GAAP): $1.62 vs analyst estimates of $0.48 (significant beat)
- Market Capitalization: $3.21 billion
Company Overview
Tracing its roots back to 1882 in the heart of Pennsylvania, Fulton Financial (NASDAQ: FULT) is a financial holding company that provides banking, lending, and wealth management services to consumers and businesses across five Mid-Atlantic states.
Sales Growth
Net interest income and and fee-based revenue are the two pillars supporting bank earnings. The former captures profit from the gap between lending rates and deposit costs, while the latter encompasses charges for banking services, credit products, wealth management, and trading activities. Luckily, Fulton Financial’s revenue grew at a solid 8.7% compounded annual growth rate over the last five years. Its growth beat the average banking company and shows its offerings resonate with customers.
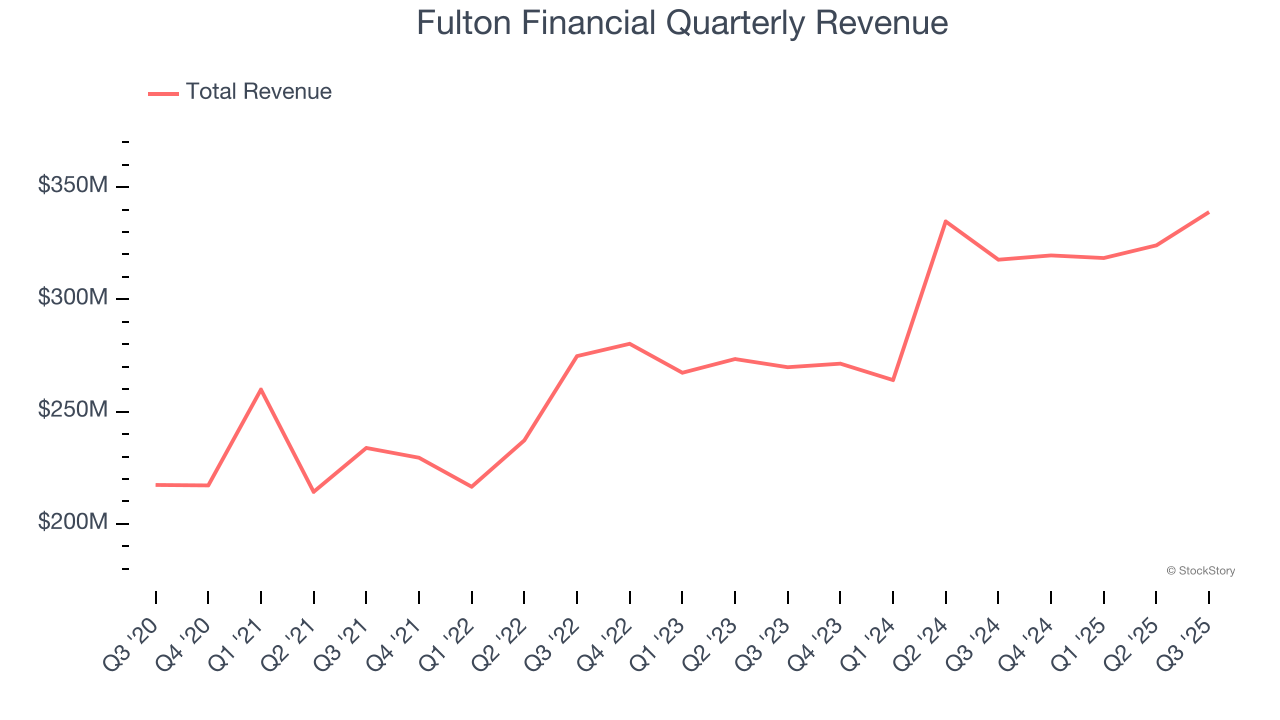
We at StockStory place the most emphasis on long-term growth, but within financials, a half-decade historical view may miss recent interest rate changes, market returns, and industry trends. Fulton Financial’s annualized revenue growth of 9.2% over the last two years aligns with its five-year trend, suggesting its demand was predictably strong. 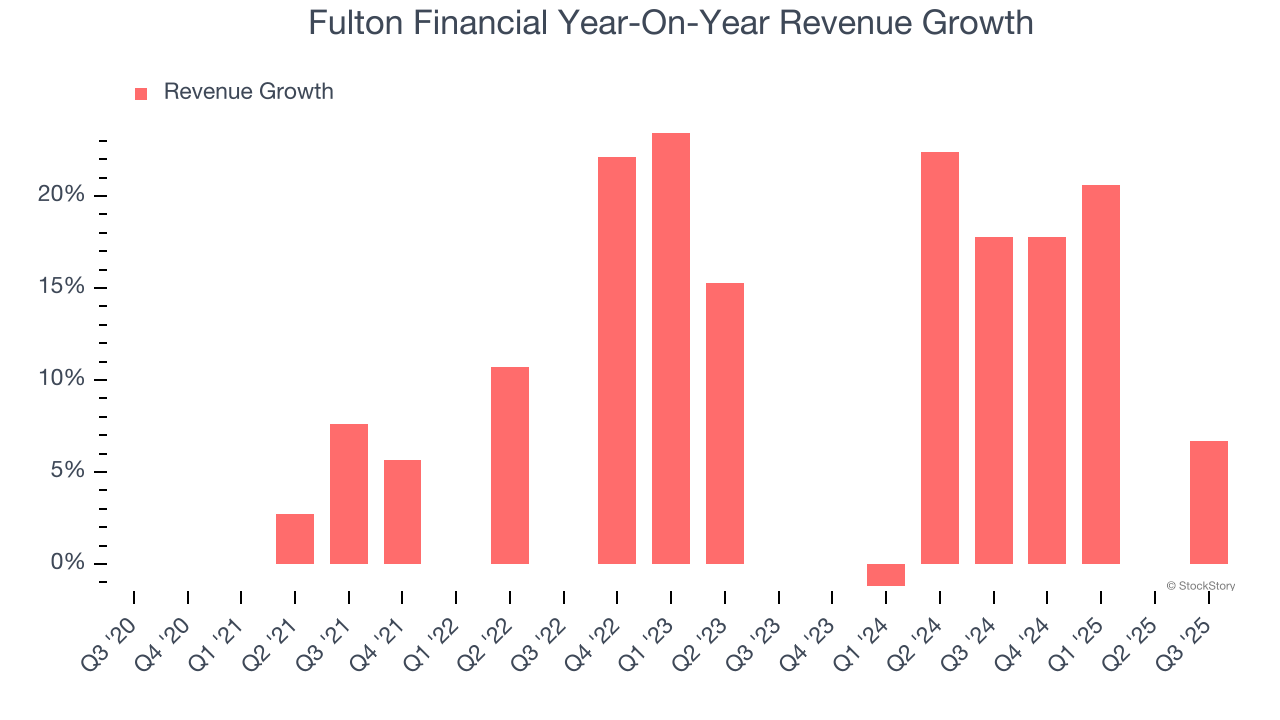 Note: Quarters not shown were determined to be outliers, impacted by outsized investment gains/losses that are not indicative of the recurring fundamentals of the business.
This quarter, Fulton Financial reported year-on-year revenue growth of 6.7%, and its $338.9 million of revenue exceeded Wall Street’s estimates by 3.2%.
Net interest income made up 76.5% of the company’s total revenue during the last five years, meaning lending operations are Fulton Financial’s largest source of revenue.
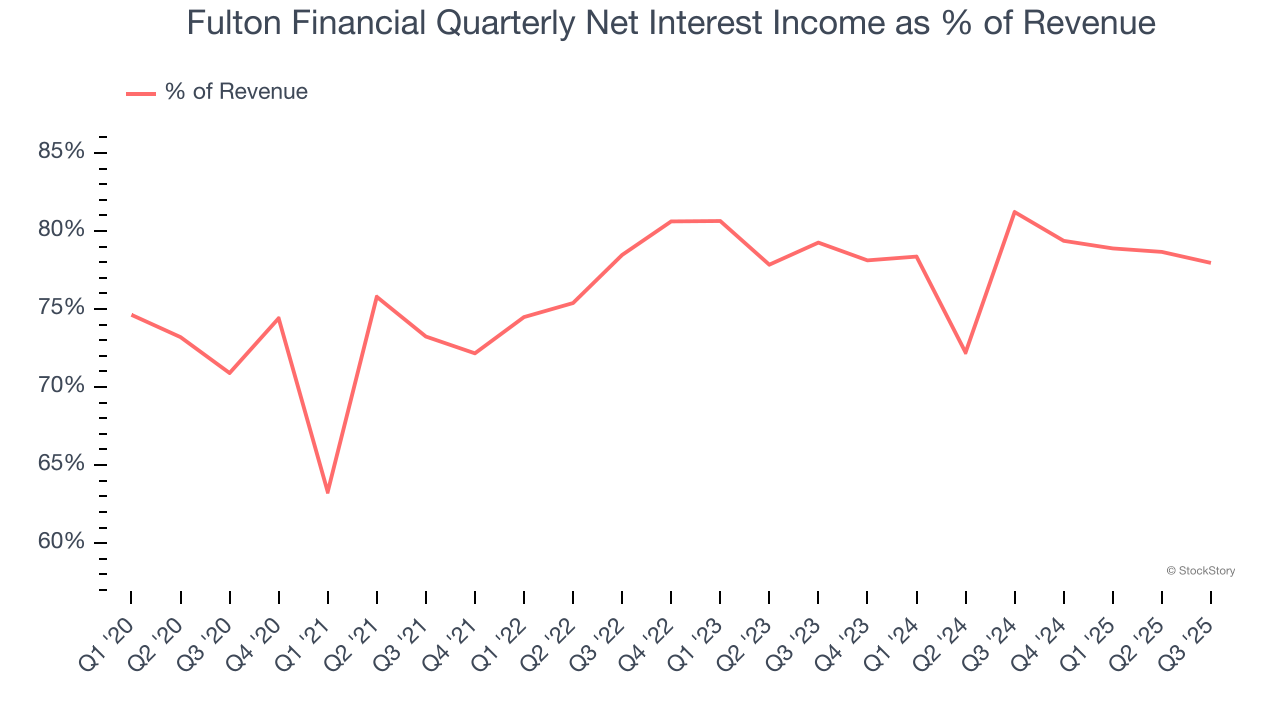
Markets consistently prioritize net interest income growth over fee-based revenue, recognizing its superior quality and recurring nature compared to the more unpredictable non-interest income streams.
Software is eating the world and there is virtually no industry left that has been untouched by it. That drives increasing demand for tools helping software developers do their jobs, whether it be monitoring critical cloud infrastructure, integrating audio and video functionality, or ensuring smooth content streaming. Click here to access a free report on our 3 favorite stocks to play this generational megatrend.
Key Takeaways from Fulton Financial’s Q3 Results
It was good to see Fulton Financial beat analysts’ EPS expectations this quarter. We were also glad its revenue outperformed Wall Street’s estimates. Zooming out, we think this was a good print with some key areas of upside. The stock remained flat at $17.88 immediately following the results.
Should you buy the stock or not? When making that decision, it’s important to consider its valuation, business qualities, as well as what has happened in the latest quarter. We cover that in our actionable full research report which you can read here, it’s free for active Edge members.