
Financial services company Pathward Financial (NASDAQ: CASH) announced better-than-expected revenue in Q3 CY2025, with sales up 3.9% year on year to $186.7 million. Its GAAP profit of $1.69 per share was 21.6% above analysts’ consensus estimates.
Is now the time to buy Pathward Financial? Find out by accessing our full research report, it’s free for active Edge members.
Pathward Financial (CASH) Q3 CY2025 Highlights:
- Net Interest Income: $128 million vs analyst estimates of $130.7 million (10.4% year-on-year growth, 2.1% miss)
- Net Interest Margin: 7.5% vs analyst estimates of 7.5% (in line)
- Revenue: $186.7 million vs analyst estimates of $182.4 million (3.9% year-on-year growth, 2.4% beat)
- EPS (GAAP): $1.69 vs analyst estimates of $1.39 (21.6% beat)
- Tangible Book Value per Share: $24.02 vs analyst estimates of $23.08 (16.2% year-on-year growth, 4.1% beat)
- Market Capitalization: $1.64 billion
CEO Brett Pharr said, "We are very pleased with our performance in the fiscal year. We completed the sale of our Insurance Premium Finance business, as well as a transportation portfolio, hired a new Chief People and Culture Officer, and won multiple awards. We did all of this and still delivered on the strategy we laid out for fiscal 2025 at the end of last year, generating both net income and earnings per diluted share growth. We believe we have put ourselves in a strong position to continue delivering on our strategy and remaining the trusted platform that enables our partners to thrive. "
Company Overview
Formerly known as Meta Financial until its 2022 rebranding, Pathward Financial (NASDAQ: CASH) provides banking-as-a-service solutions and commercial finance products, enabling partners to offer financial services like prepaid cards, payment processing, and lending options.
Sales Growth
In general, banks make money from two primary sources. The first is net interest income, which is interest earned on loans, mortgages, and investments in securities minus interest paid out on deposits. The second source is non-interest income, which can come from bank account, credit card, wealth management, investing banking, and trading fees. Over the last five years, Pathward Financial grew its revenue at an excellent 11.8% compounded annual growth rate. Its growth surpassed the average banking company and shows its offerings resonate with customers, a great starting point for our analysis.
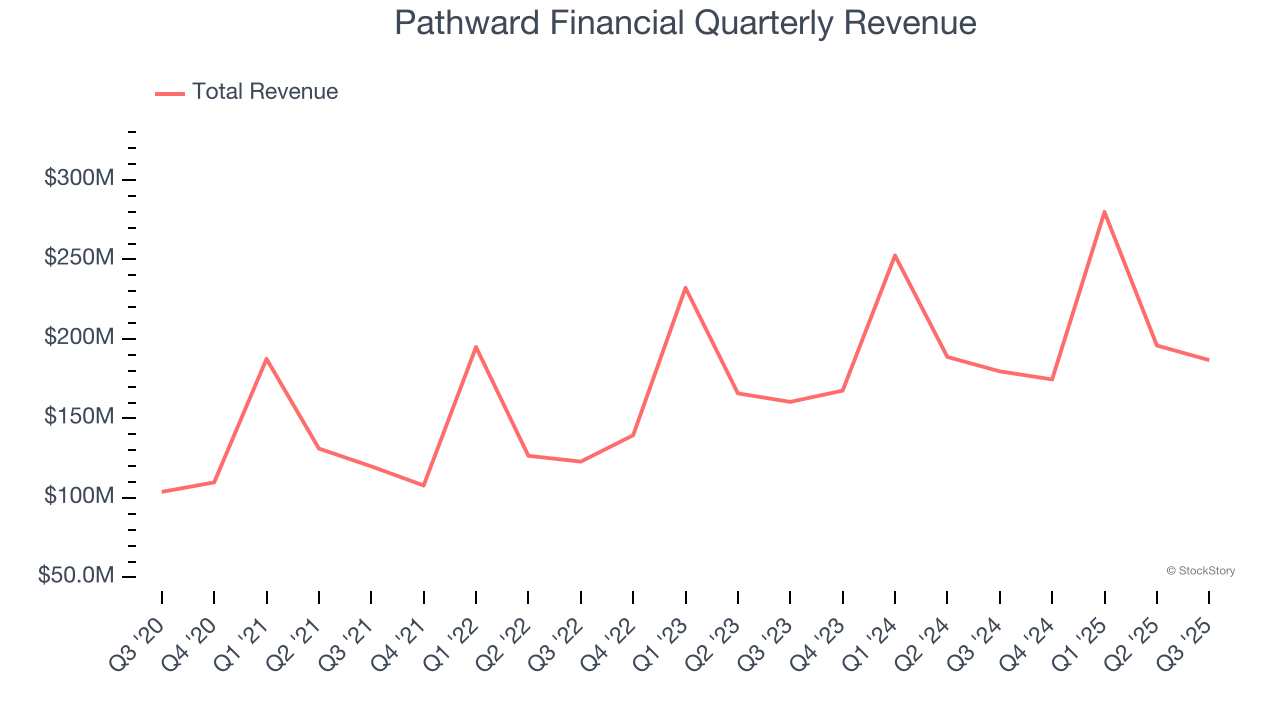
Long-term growth is the most important, but within financials, a half-decade historical view may miss recent interest rate changes and market returns. Pathward Financial’s annualized revenue growth of 9.5% over the last two years is below its five-year trend, but we still think the results suggest healthy demand. 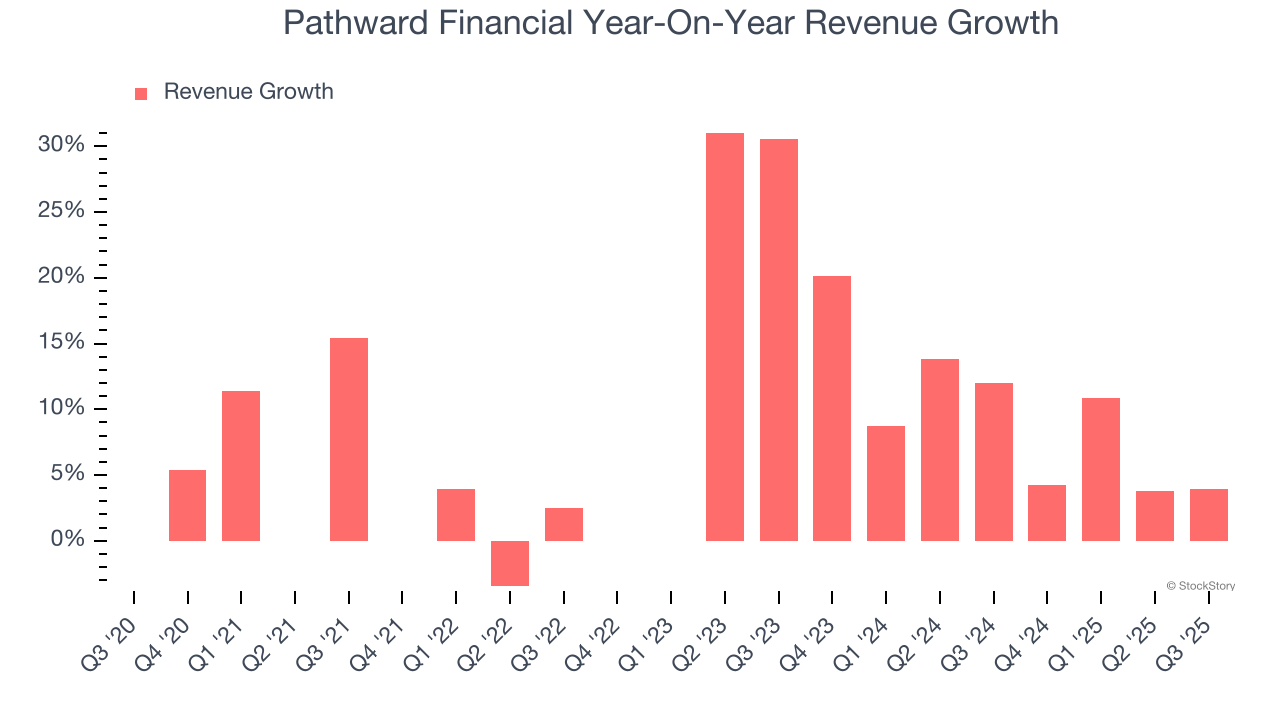 Note: Quarters not shown were determined to be outliers, impacted by outsized investment gains/losses that are not indicative of the recurring fundamentals of the business.
This quarter, Pathward Financial reported modest year-on-year revenue growth of 3.9% but beat Wall Street’s estimates by 2.4%.
Net interest income made up 57.4% of the company’s total revenue during the last five years, meaning Pathward Financial’s growth drivers strike a balance between lending and non-lending activities.
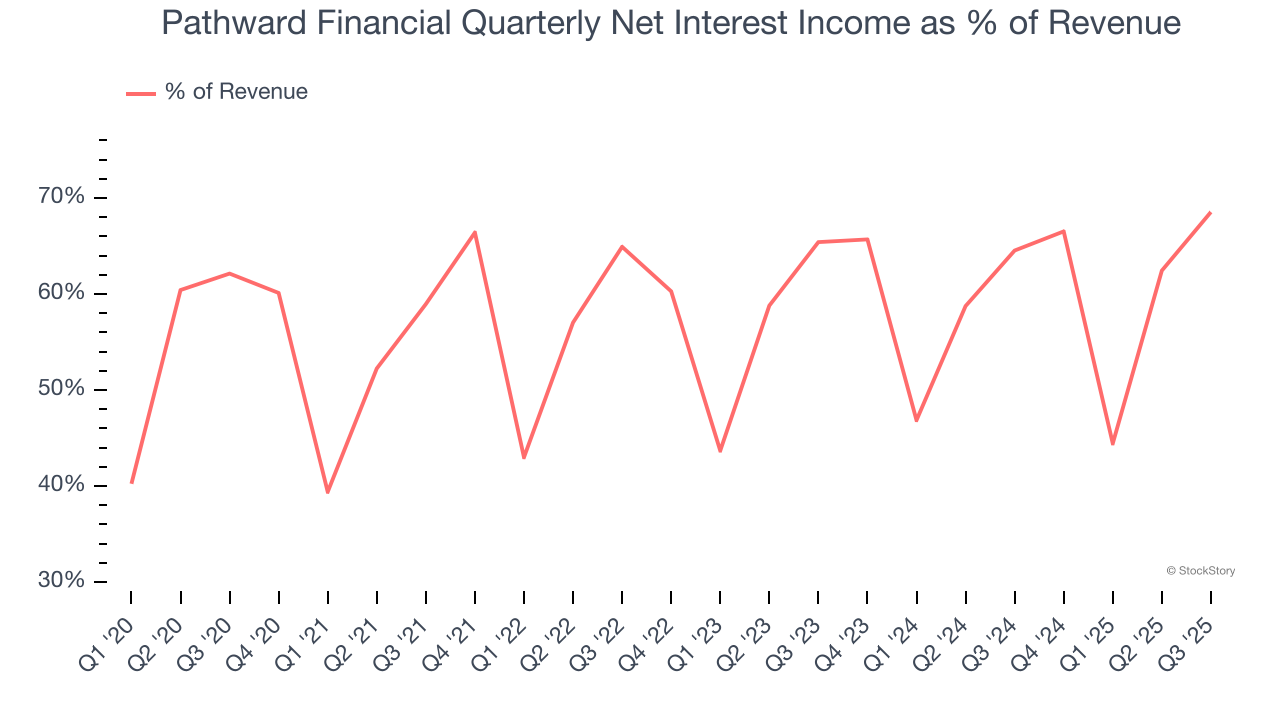
Net interest income commands greater market attention due to its reliability and consistency, whereas non-interest income is often seen as lower-quality revenue that lacks the same dependable characteristics.
Here at StockStory, we certainly understand the potential of thematic investing. Diverse winners from Microsoft (MSFT) to Alphabet (GOOG), Coca-Cola (KO) to Monster Beverage (MNST) could all have been identified as promising growth stories with a megatrend driving the growth. So, in that spirit, we’ve identified a relatively under-the-radar profitable growth stock benefiting from the rise of AI, available to you FREE via this link.
Tangible Book Value Per Share (TBVPS)
Banks are balance sheet-driven businesses because they generate earnings primarily through borrowing and lending. They’re also valued based on their balance sheet strength and ability to compound book value (another name for shareholders’ equity) over time.
This is why we consider tangible book value per share (TBVPS) the most important metric to track for banks. TBVPS represents the real, liquid net worth per share of a bank, excluding intangible assets that have debatable value upon liquidation. On the other hand, EPS is often distorted by mergers and flexible loan loss accounting. TBVPS provides clearer performance insights.
Pathward Financial’s TBVPS grew at an incredible 10.9% annual clip over the last five years. TBVPS growth has also accelerated recently, growing by 39.9% annually over the last two years from $12.28 to $24.02 per share.
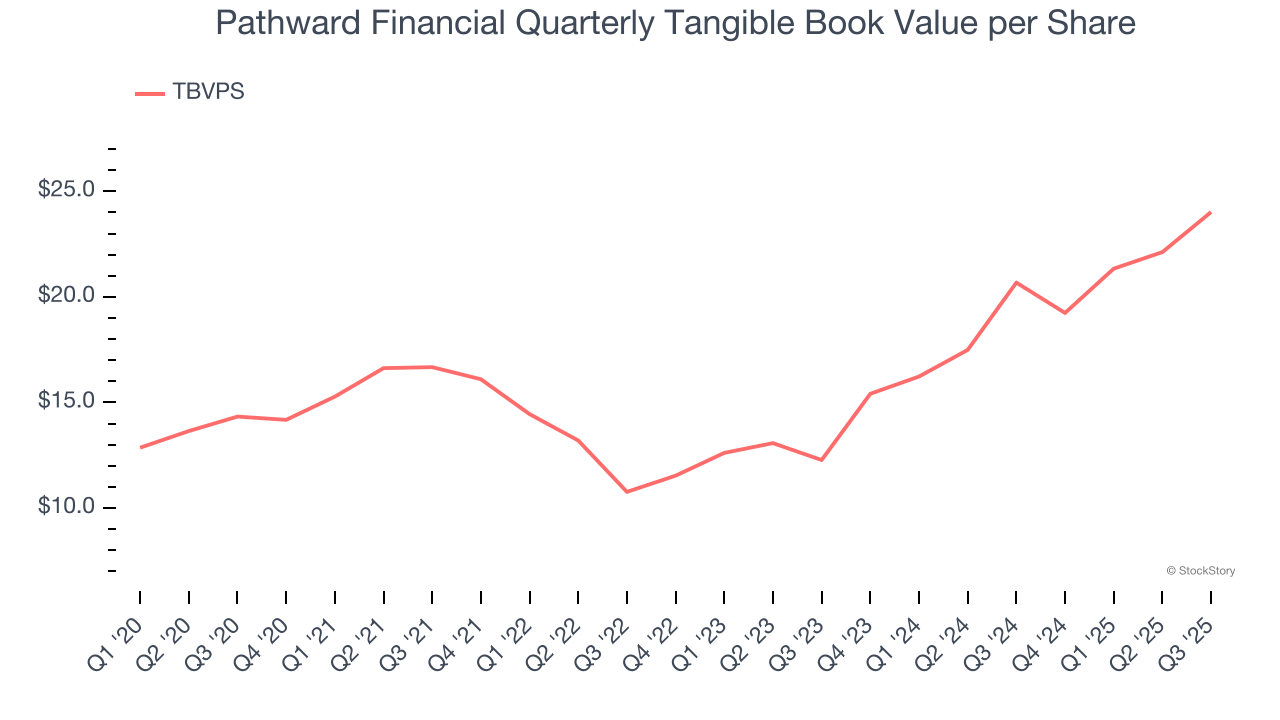
Over the next 12 months, Consensus estimates call for Pathward Financial’s TBVPS to grow by 23.4% to $29.64, elite growth rate.
Key Takeaways from Pathward Financial’s Q3 Results
It was good to see Pathward Financial beat analysts’ EPS expectations this quarter. We were also glad its tangible book value per share outperformed Wall Street’s estimates. On the other hand, its net interest income missed. Overall, while it was not a perfect quarter, we think it was a solid one with some key areas of upside. The stock traded up 1.8% to $73 immediately following the results.
Pathward Financial put up rock-solid earnings, but one quarter doesn’t necessarily make the stock a buy. Let’s see if this is a good investment. The latest quarter does matter, but not nearly as much as longer-term fundamentals and valuation, when deciding if the stock is a buy. We cover that in our actionable full research report which you can read here, it’s free for active Edge members.


