
Healthcare diagnostics company Quest Diagnostics (NYSE: DGX) reported revenue ahead of Wall Street’s expectations in Q3 CY2025, with sales up 13.2% year on year to $2.82 billion. The company’s full-year revenue guidance of $10.98 billion at the midpoint came in 1% above analysts’ estimates. Its non-GAAP profit of $2.60 per share was 3.9% above analysts’ consensus estimates.
Is now the time to buy Quest? Find out by accessing our full research report, it’s free for active Edge members.
Quest (DGX) Q3 CY2025 Highlights:
- Revenue: $2.82 billion vs analyst estimates of $2.73 billion (13.2% year-on-year growth, 3.3% beat)
- Adjusted EPS: $2.60 vs analyst estimates of $2.50 (3.9% beat)
- The company lifted its revenue guidance for the full year to $10.98 billion at the midpoint from $10.86 billion, a 1.1% increase
- Management slightly raised its full-year Adjusted EPS guidance to $9.80 at the midpoint
- Operating Margin: 13.7%, in line with the same quarter last year
- Free Cash Flow Margin: 14.9%, up from 10% in the same quarter last year
- Sales Volumes rose 12.5% year on year (5.5% in the same quarter last year)
- Market Capitalization: $21.29 billion
"We delivered another quarter of robust top- and bottom-line growth, underscoring strong demand for our clinical solutions and diligent execution of our strategy," said Jim Davis, Chairman, CEO and President.
Company Overview
Processing approximately one-third of the adult U.S. population's lab tests annually, Quest Diagnostics (NYSE: DGX) provides laboratory testing and diagnostic information services to patients, physicians, hospitals, and other healthcare providers across the United States.
Revenue Growth
Examining a company’s long-term performance can provide clues about its quality. Any business can have short-term success, but a top-tier one grows for years. Regrettably, Quest’s sales grew at a mediocre 5.3% compounded annual growth rate over the last five years. This fell short of our benchmark for the healthcare sector and is a rough starting point for our analysis.
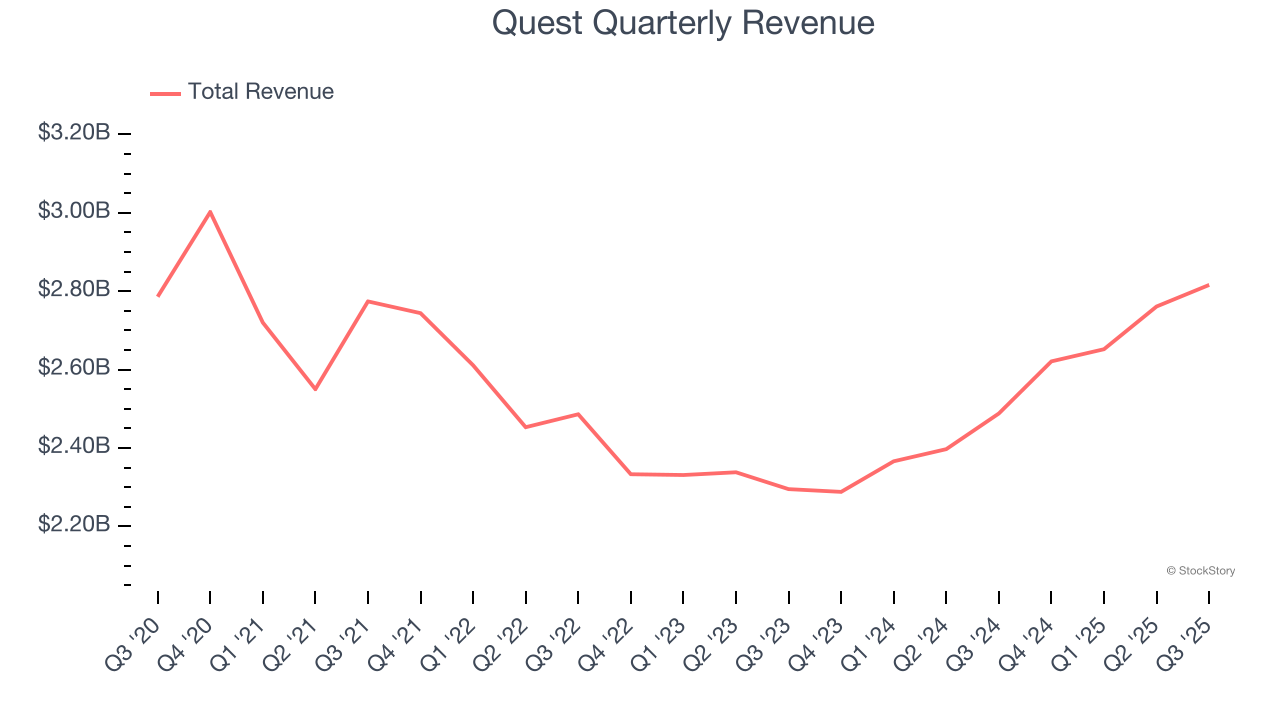
Long-term growth is the most important, but within healthcare, a half-decade historical view may miss new innovations or demand cycles. Quest’s annualized revenue growth of 8% over the last two years is above its five-year trend, suggesting some bright spots. 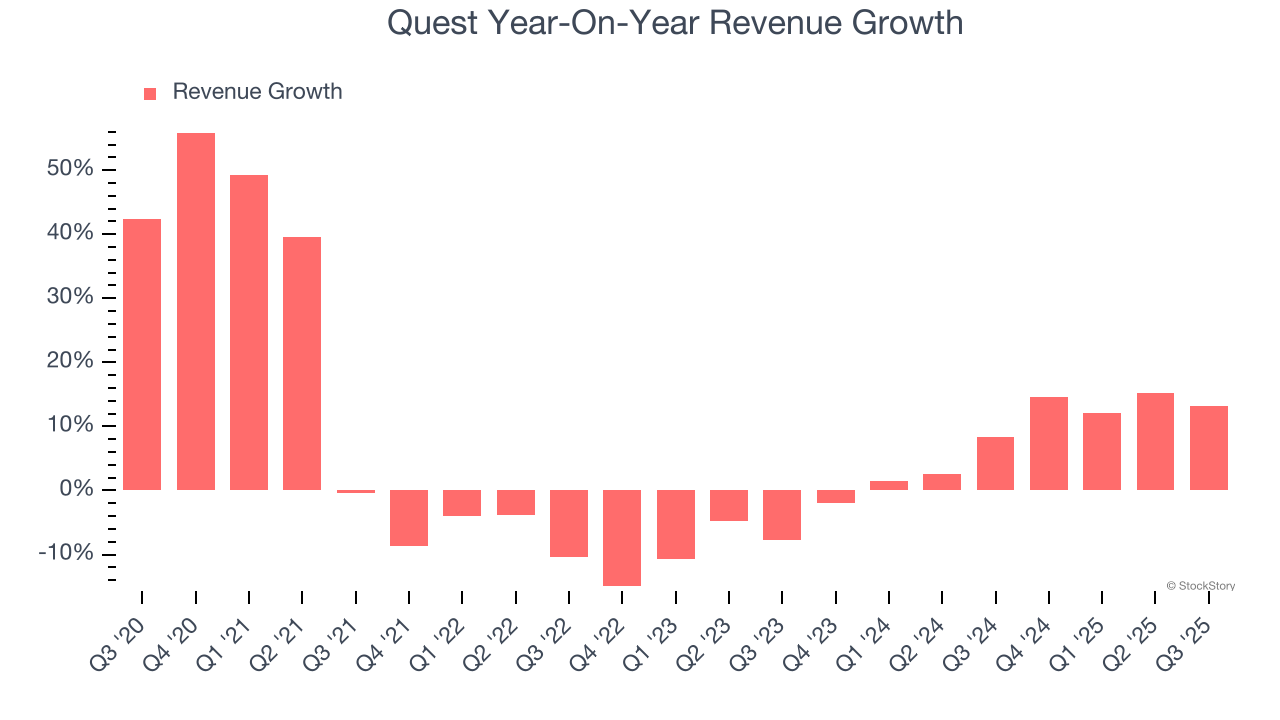
We can better understand the company’s revenue dynamics by analyzing its number of requisition volumes. Over the last two years, Quest’s requisition volumes averaged 8.1% year-on-year growth. Because this number is in line with its revenue growth, we can see the company kept its prices fairly consistent. 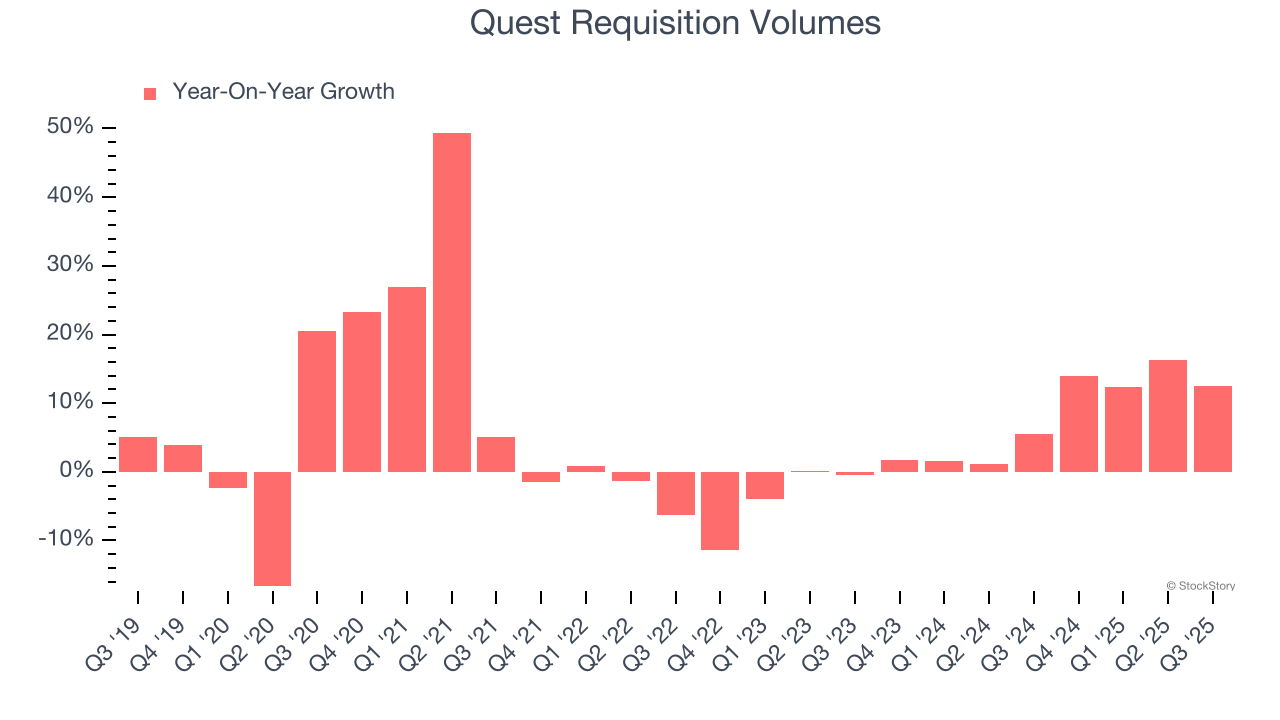
This quarter, Quest reported year-on-year revenue growth of 13.2%, and its $2.82 billion of revenue exceeded Wall Street’s estimates by 3.3%.
Looking ahead, sell-side analysts expect revenue to grow 2.7% over the next 12 months, a deceleration versus the last two years. This projection is underwhelming and implies its products and services will see some demand headwinds.
Unless you’ve been living under a rock, it should be obvious by now that generative AI is going to have a huge impact on how large corporations do business. While Nvidia and AMD are trading close to all-time highs, we prefer a lesser-known (but still profitable) stock benefiting from the rise of AI. Click here to access our free report one of our favorites growth stories.
Operating Margin
Quest has managed its cost base well over the last five years. It demonstrated solid profitability for a healthcare business, producing an average operating margin of 16.4%.
Looking at the trend in its profitability, Quest’s operating margin decreased by 9.8 percentage points over the last five years, but it rose by 2 percentage points on a two-year basis. Still, shareholders will want to see Quest become more profitable in the future.
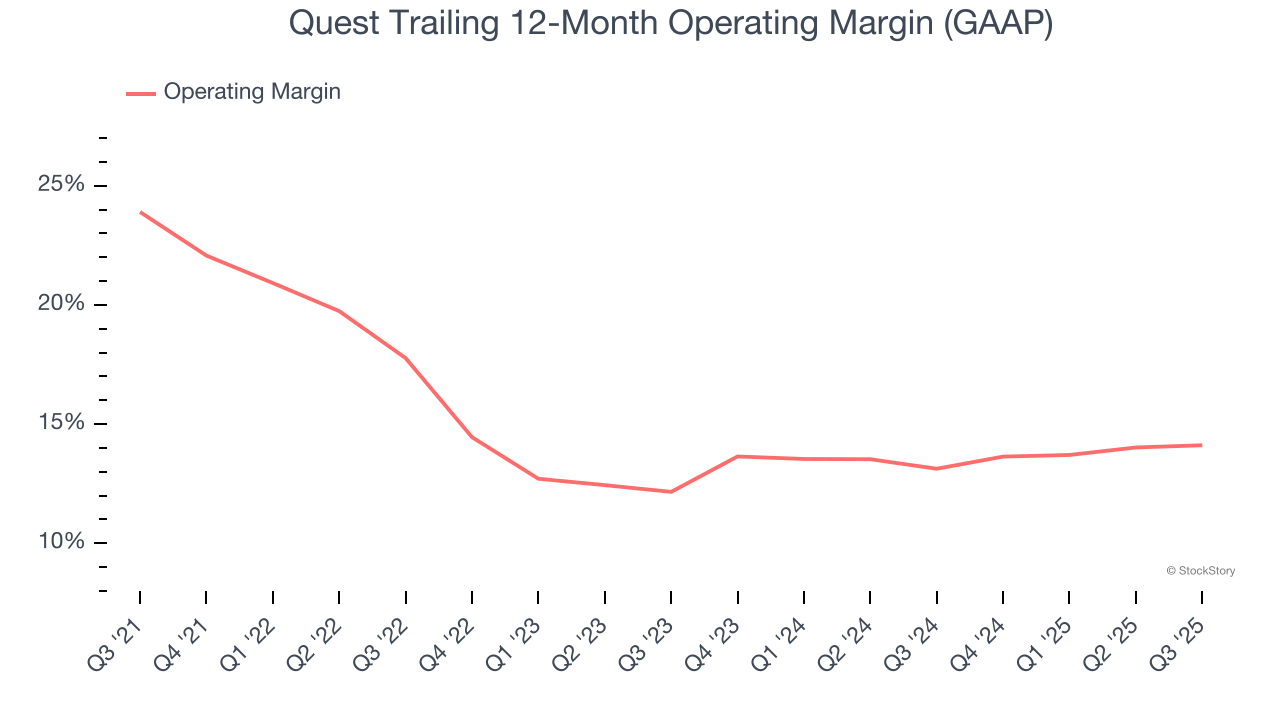
This quarter, Quest generated an operating margin profit margin of 13.7%, in line with the same quarter last year. This indicates the company’s overall cost structure has been relatively stable.
Earnings Per Share
Revenue trends explain a company’s historical growth, but the long-term change in earnings per share (EPS) points to the profitability of that growth – for example, a company could inflate its sales through excessive spending on advertising and promotions.
Quest’s EPS grew at an unimpressive 3% compounded annual growth rate over the last five years, lower than its 5.3% annualized revenue growth. This tells us the company became less profitable on a per-share basis as it expanded due to non-fundamental factors such as interest expenses and taxes.
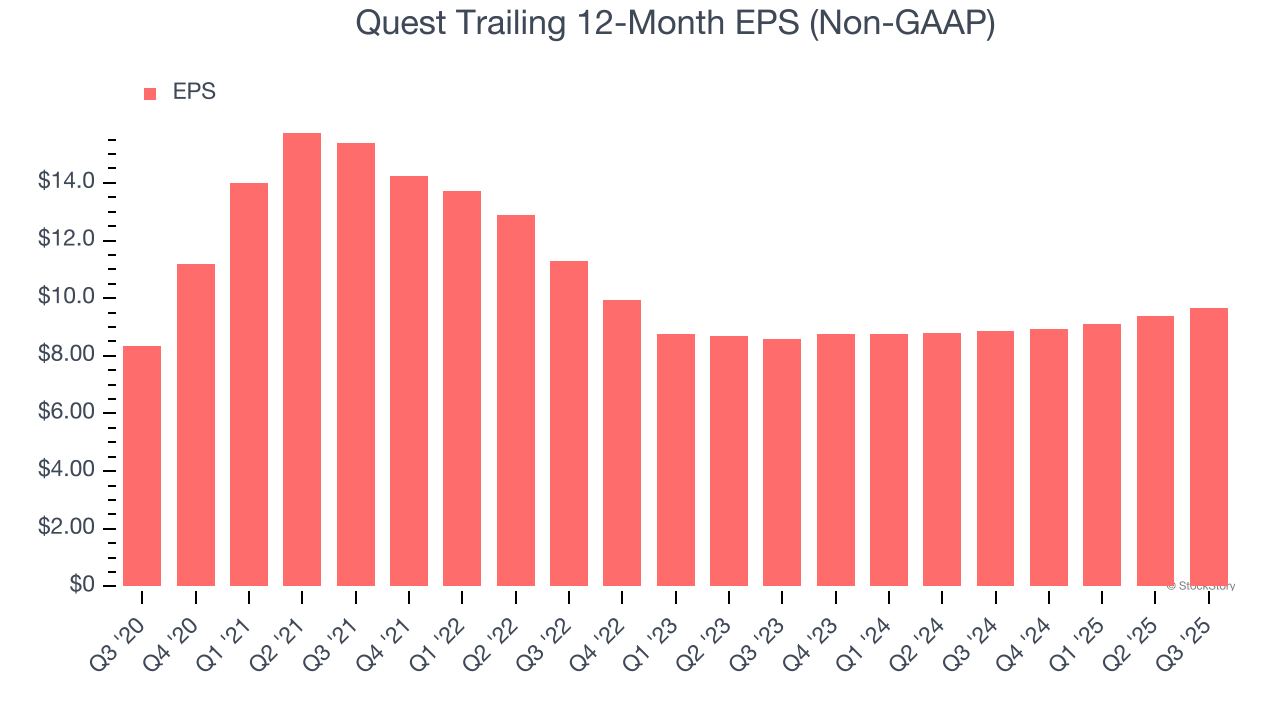
We can take a deeper look into Quest’s earnings to better understand the drivers of its performance. As we mentioned earlier, Quest’s operating margin was flat this quarter but declined by 9.8 percentage points over the last five years. This was the most relevant factor (aside from the revenue impact) behind its lower earnings; interest expenses and taxes can also affect EPS but don’t tell us as much about a company’s fundamentals.
In Q3, Quest reported adjusted EPS of $2.60, up from $2.30 in the same quarter last year. This print beat analysts’ estimates by 3.9%. Over the next 12 months, Wall Street expects Quest’s full-year EPS of $9.67 to grow 4.8%.
Key Takeaways from Quest’s Q3 Results
We enjoyed seeing Quest beat analysts’ revenue and EPS expectations this quarter. We were also glad its full-year revenue guidance slightly exceeded Wall Street’s estimates. Overall, we think this was a solid quarter with some key areas of upside. The stock traded up 2.4% to $195 immediately after reporting.
Indeed, Quest had a rock-solid quarterly earnings result, but is this stock a good investment here? The latest quarter does matter, but not nearly as much as longer-term fundamentals and valuation, when deciding if the stock is a buy. We cover that in our actionable full research report which you can read here, it’s free for active Edge members.


