
Trupanion trades at $44.30 and has moved in lockstep with the market. Its shares have returned 26.6% over the last six months while the S&P 500 has gained 27.3%.
Is TRUP a buy right now? Find out in our full research report, it’s free for active Edge members.
Why Does TRUP Stock Spark Debate?
Born from a vision to help pet owners avoid economic euthanasia when faced with expensive veterinary bills, Trupanion (NASDAQ: TRUP) provides medical insurance for cats and dogs through data-driven, vertically-integrated products priced specifically for each pet's unique characteristics.
Two Positive Attributes:
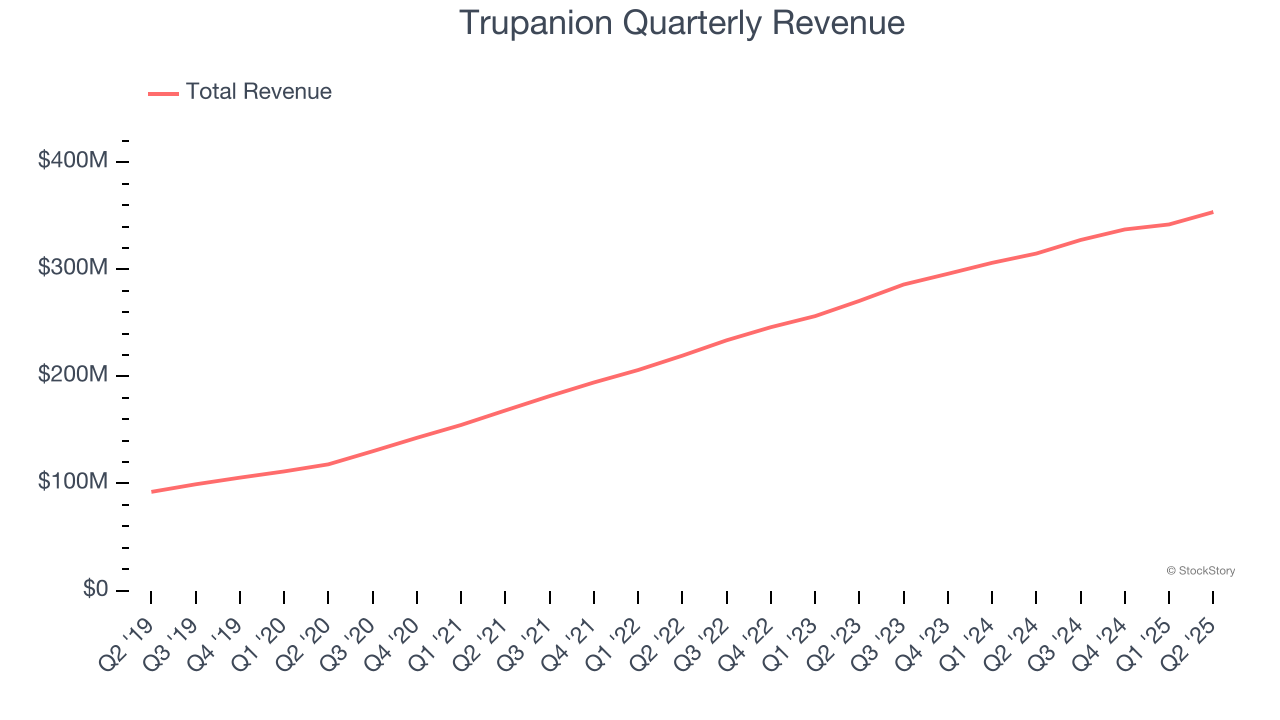
1. Skyrocketing Revenue Shows Strong Momentum
Insurers earn revenue three ways. The core insurance business itself, often called underwriting and represented in the income statement as premiums earned, is one way. Investment income from investing the “float” (premiums collected upfront not yet paid out as claims) in assets such as fixed-income assets and equities is the second way. Fees from various sources such as policy administration, annuities, or other value-added services is the third.
Thankfully, Trupanion’s 25.7% annualized revenue growth over the last five years was incredible. Its growth surpassed the average insurance company and shows its offerings resonate with customers.
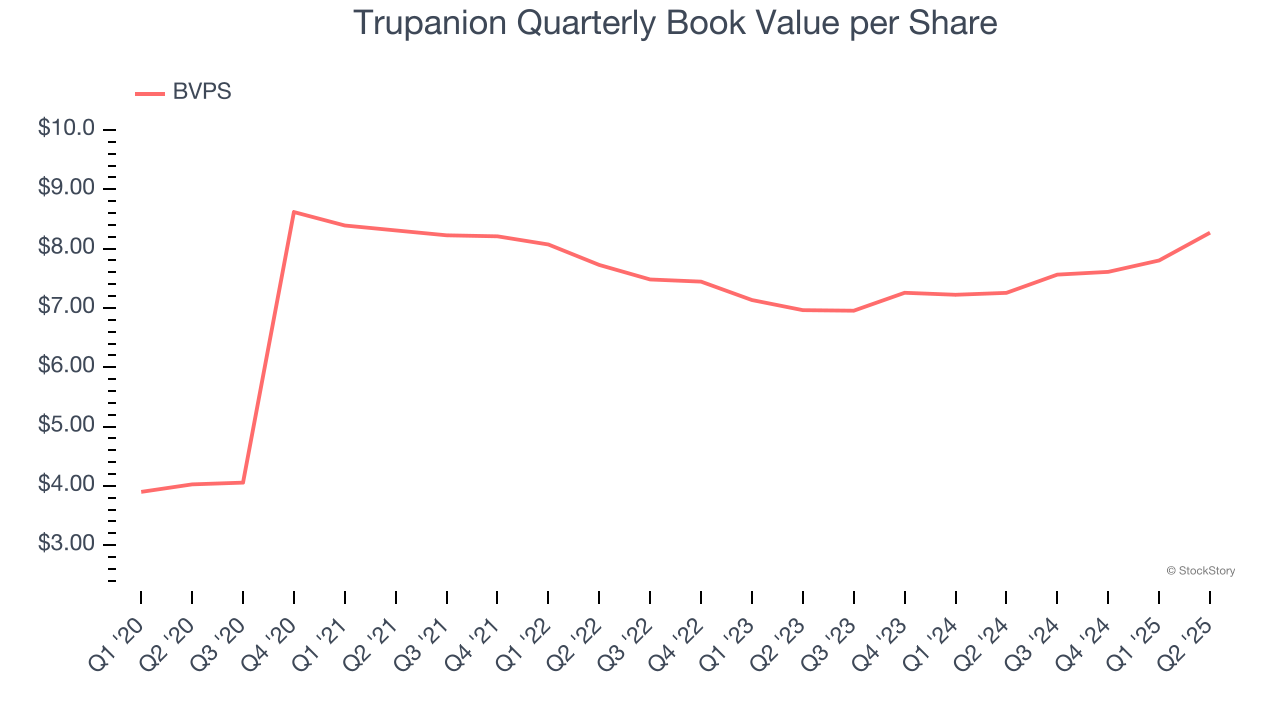
2. Substandard BVPS Growth Indicates Limited Asset Expansion
Book value per share (BVPS) serves as a key indicator of an insurer’s financial stability, reflecting a company’s ability to maintain adequate capital levels and meet its long-term obligations to policyholders.
Although Trupanion’s BVPS increased by 15.5% annually over the last five years, growth has recently decelerated to a tepid 9% over the past two years (from $6.96 to $8.27 per share).
One Reason to be Careful:
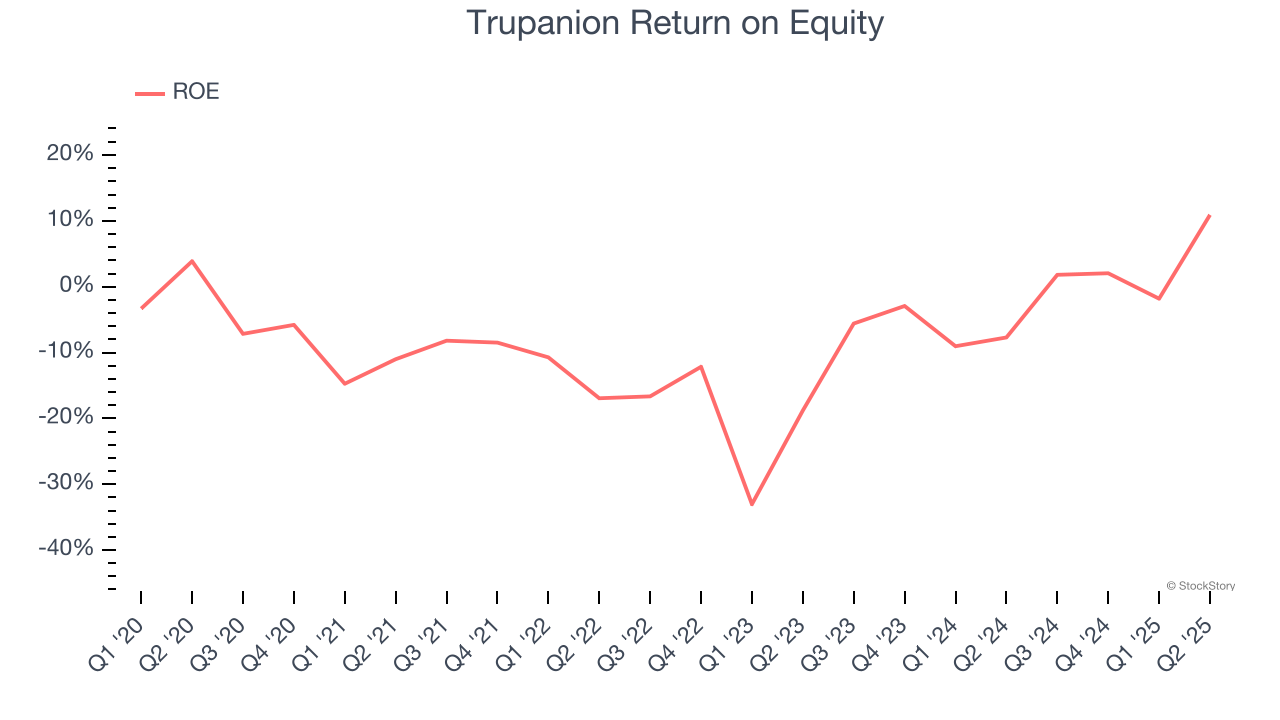
Previous Growth Initiatives Have Lost Money
Return on equity (ROE) is a crucial yardstick for insurance companies, measuring their ability to generate returns on the capital provided by shareholders. Insurers that consistently deliver superior ROE tend to create more value for their investors over time through strategic capital allocation and shareholder-friendly policies.
Over the last five years, Trupanion has averaged an ROE of negative 8.8%, a disappointing result relative to the majority of insurers putting up 20%+. But we wouldn’t write off Trupanion given its success in other measures of financial health.
Final Judgment
Trupanion has huge potential even though it has some open questions, but at $44.30 per share (or 5.1× forward P/B), is now the right time to buy the stock? See for yourself in our in-depth research report, it’s free for active Edge members.
Stocks We Like Even More Than Trupanion
Donald Trump’s April 2025 "Liberation Day" tariffs sent markets into a tailspin, but stocks have since rebounded strongly, proving that knee-jerk reactions often create the best buying opportunities.
The smart money is already positioning for the next leg up. Don’t miss out on the recovery - check out our Top 6 Stocks for this week. This is a curated list of our High Quality stocks that have generated a market-beating return of 183% over the last five years (as of March 31st 2025).
Stocks that made our list in 2020 include now familiar names such as Nvidia (+1,545% between March 2020 and March 2025) as well as under-the-radar businesses like the once-micro-cap company Kadant (+351% five-year return). Find your next big winner with StockStory today.
StockStory is growing and hiring equity analyst and marketing roles. Are you a 0 to 1 builder passionate about the markets and AI? See the open roles here.


