
Over the past six months, Anheuser-Busch’s stock price fell to $61.90. Shareholders have lost 7.5% of their capital, which is disappointing considering the S&P 500 has climbed by 27.3%. This was partly driven by its softer quarterly results and might have investors contemplating their next move.
Is now the time to buy Anheuser-Busch, or should you be careful about including it in your portfolio? Get the full breakdown from our expert analysts, it’s free for active Edge members.
Why Is Anheuser-Busch Not Exciting?
Even with the cheaper entry price, we don't have much confidence in Anheuser-Busch. Here are three reasons you should be careful with BUD and a stock we'd rather own.
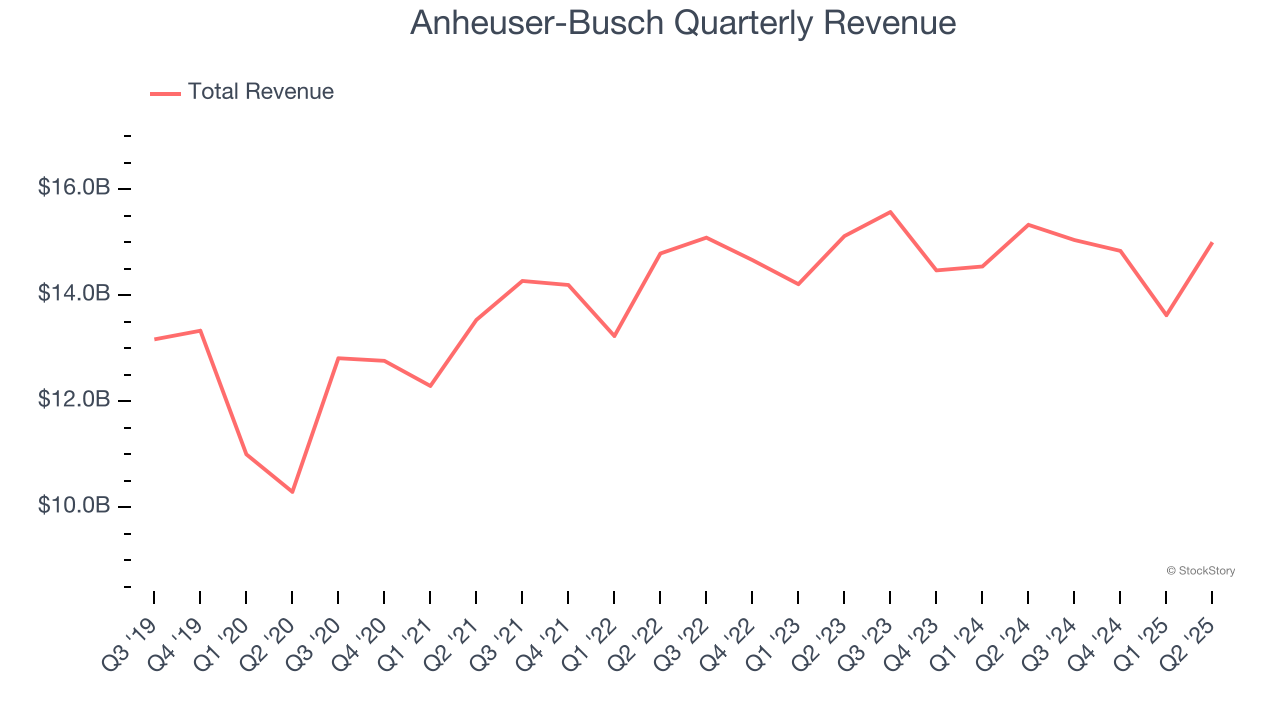
1. Long-Term Revenue Growth Disappoints
A company’s long-term sales performance is one signal of its overall quality. Any business can experience short-term success, but top-performing ones enjoy sustained growth for years. Regrettably, Anheuser-Busch’s sales grew at a weak 1.2% compounded annual growth rate over the last three years. This was below our standards.
2. Demand Slipping as Sales Volumes Decline
Revenue growth can be broken down into changes in price and volume (the number of units sold). While both are important, volume is the lifeblood of a successful staples business as there’s a ceiling to what consumers will pay for everyday goods; they can always trade down to non-branded products if the branded versions are too expensive.
Anheuser-Busch’s average quarterly sales volumes have shrunk by 2% over the last two years. This decrease isn’t ideal because the quantity demanded for consumer staples products is typically stable. 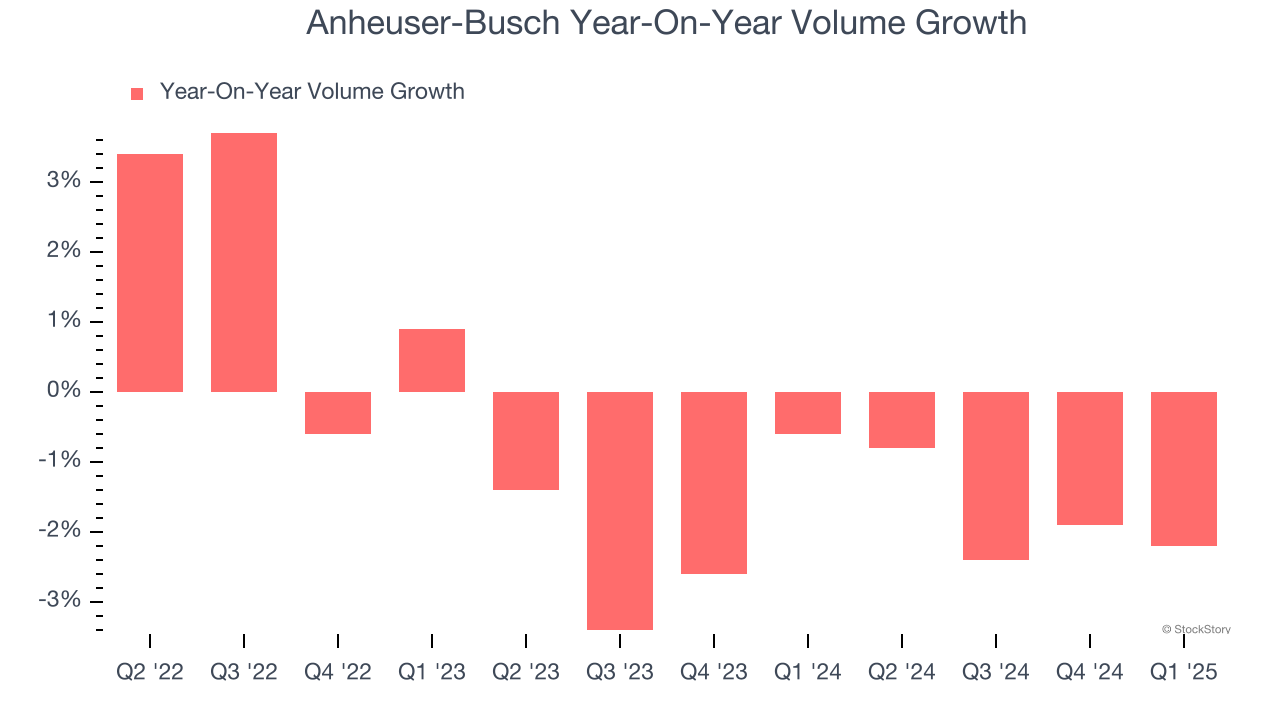
3. Slow Organic Growth Suggests Waning Demand In Core Business
When analyzing revenue growth, we care most about organic revenue growth. This metric captures a business’s performance excluding one-time events such as mergers, acquisitions, and divestitures as well as foreign currency fluctuations.
The demand for Anheuser-Busch’s products has been stable over the last eight quarters but fell behind the broader sector. On average, the company has posted feeble year-on-year organic revenue growth of 1.6%. 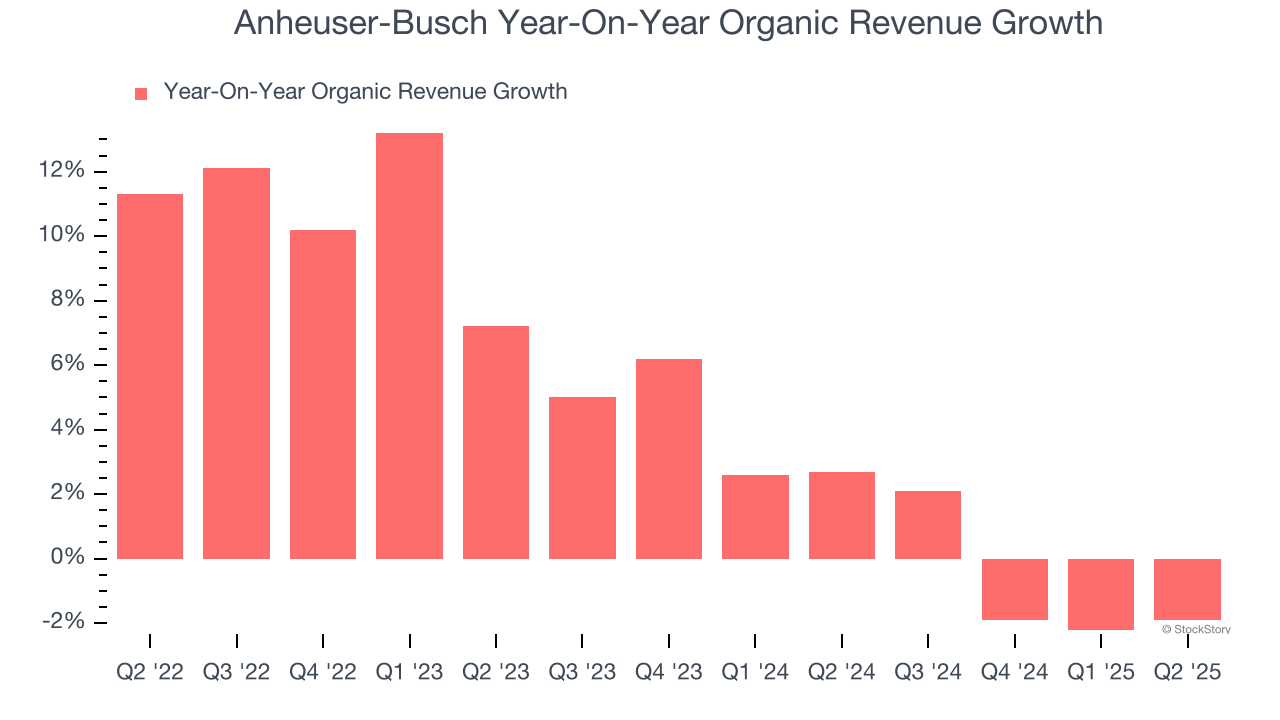
Final Judgment
Anheuser-Busch isn’t a terrible business, but it isn’t one of our picks. Following the recent decline, the stock trades at 5.8× forward EV-to-EBITDA (or $61.90 per share). While this valuation is reasonable, we don’t really see a big opportunity at the moment. We're fairly confident there are better stocks to buy right now. We’d suggest looking at the Amazon and PayPal of Latin America.
High-Quality Stocks for All Market Conditions
Donald Trump’s April 2025 "Liberation Day" tariffs sent markets into a tailspin, but stocks have since rebounded strongly, proving that knee-jerk reactions often create the best buying opportunities.
The smart money is already positioning for the next leg up. Don’t miss out on the recovery - check out our Top 5 Strong Momentum Stocks for this week. This is a curated list of our High Quality stocks that have generated a market-beating return of 183% over the last five years (as of March 31st 2025).
Stocks that made our list in 2020 include now familiar names such as Nvidia (+1,545% between March 2020 and March 2025) as well as under-the-radar businesses like the once-micro-cap company Tecnoglass (+1,754% five-year return). Find your next big winner with StockStory today.
StockStory is growing and hiring equity analyst and marketing roles. Are you a 0 to 1 builder passionate about the markets and AI? See the open roles here.


