
Regional bank Banc of California (NYSE: BANC) announced better-than-expected revenue in Q3 CY2025, with sales up 32.8% year on year to $287.7 million. Its GAAP profit of $0.38 per share was 14.4% above analysts’ consensus estimates.
Is now the time to buy Banc of California? Find out by accessing our full research report, it’s free for active Edge members.
Banc of California (BANC) Q3 CY2025 Highlights:
- Net Interest Income: $253.4 million vs analyst estimates of $251.3 million (9.2% year-on-year growth, 0.8% beat)
- Net Interest Margin: 3.2% vs analyst estimates of 3.1% (7.7 basis point beat)
- Revenue: $287.7 million vs analyst estimates of $282.7 million (32.8% year-on-year growth, 1.8% beat)
- Efficiency Ratio: 62.1% vs analyst estimates of 66.4% (431.9 basis point beat)
- EPS (GAAP): $0.38 vs analyst estimates of $0.33 (14.4% beat)
- Tangible Book Value per Share: $16.99 vs analyst estimates of $16.75 (8.5% year-on-year growth, 1.4% beat)
- Market Capitalization: $2.64 billion
Company Overview
Originally established in 1941 and now operating with a tech-forward approach that includes its SmartStreet platform for homeowner associations, Banc of California (NYSE: BANC) is a California-based bank holding company that provides banking services to small and middle-market businesses, entrepreneurs, and individuals.
Sales Growth
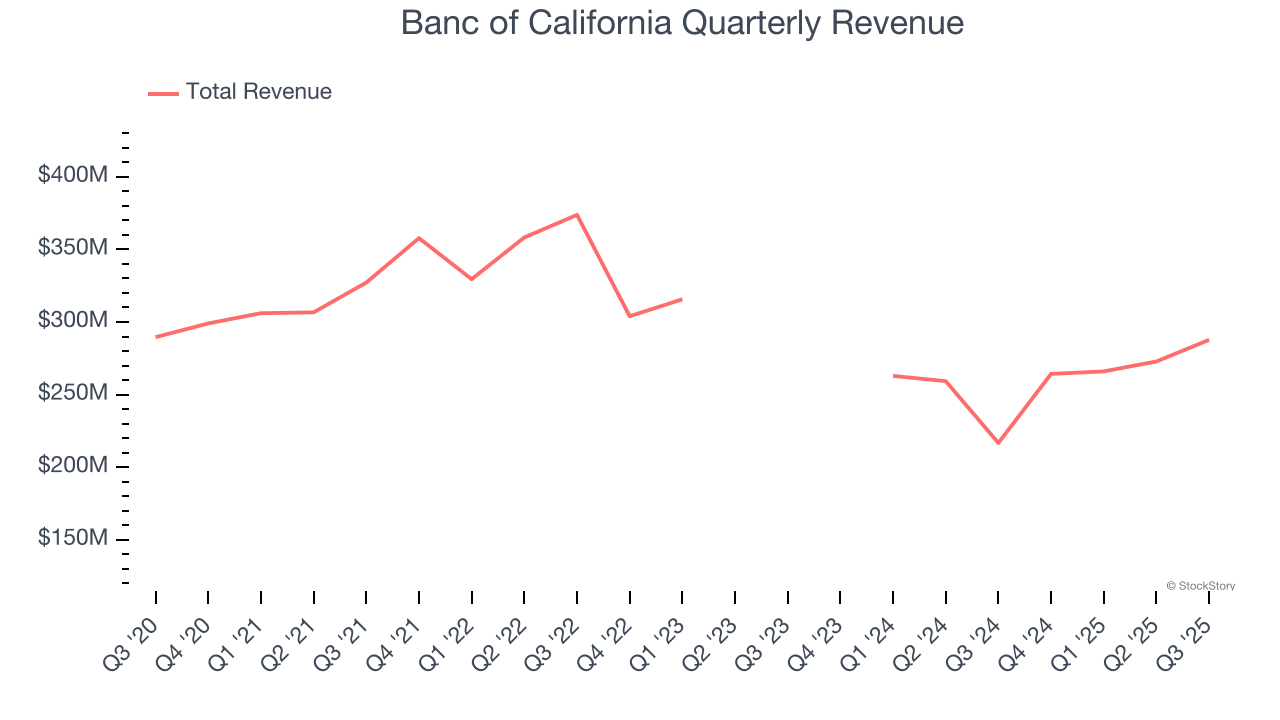
Two primary revenue streams drive bank earnings. While net interest income, which is earned by charging higher rates on loans than paid on deposits, forms the foundation, fee-based services across banking, credit, wealth management, and trading operations provide additional income. Unfortunately, Banc of California struggled to consistently increase demand as its $1.09 billion of revenue for the trailing 12 months was close to its revenue five years ago. This was below our standards and suggests it’s a lower quality business.
 Note: Quarters not shown were determined to be outliers, impacted by outsized investment gains/losses that are not indicative of the recurring fundamentals of the business.
We at StockStory place the most emphasis on long-term growth, but within financials, a half-decade historical view may miss recent interest rate changes, market returns, and industry trends. Banc of California’s annualized revenue growth of 55.3% over the last two years is above its five-year trend, suggesting its demand recently accelerated. 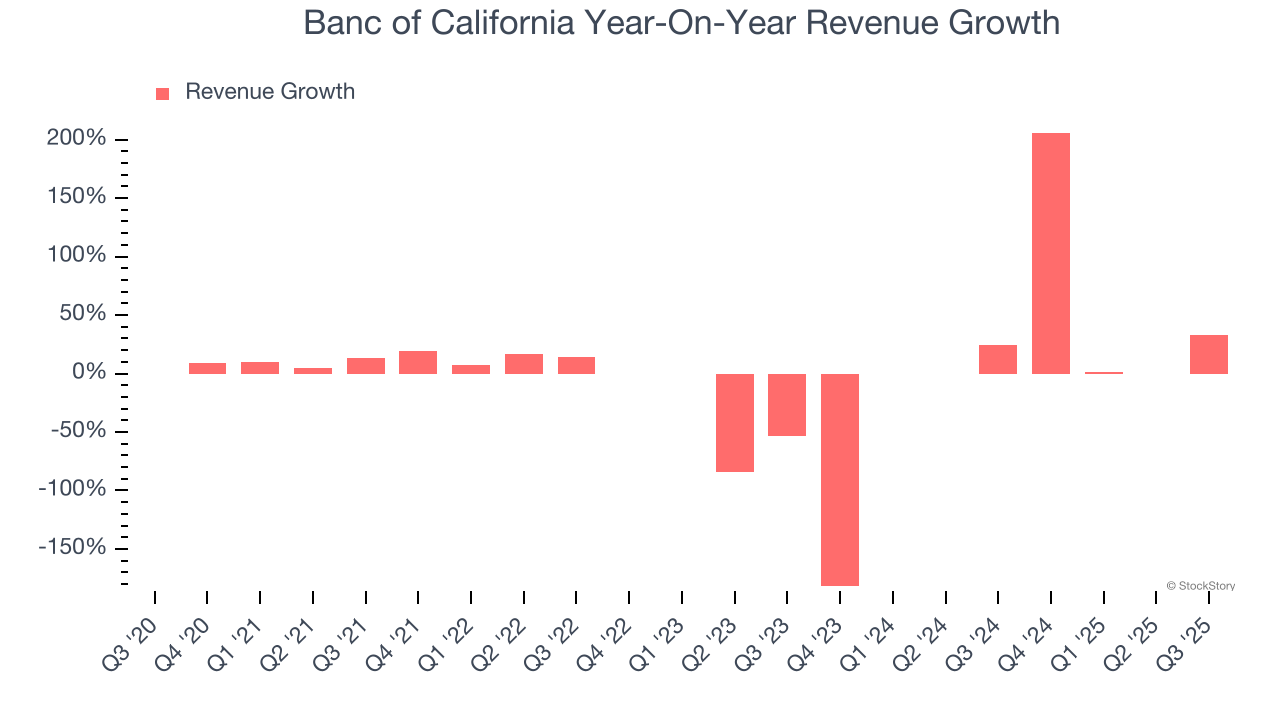 Note: Quarters not shown were determined to be outliers, impacted by outsized investment gains/losses that are not indicative of the recurring fundamentals of the business.
This quarter, Banc of California reported wonderful year-on-year revenue growth of 32.8%, and its $287.7 million of revenue exceeded Wall Street’s estimates by 1.8%.
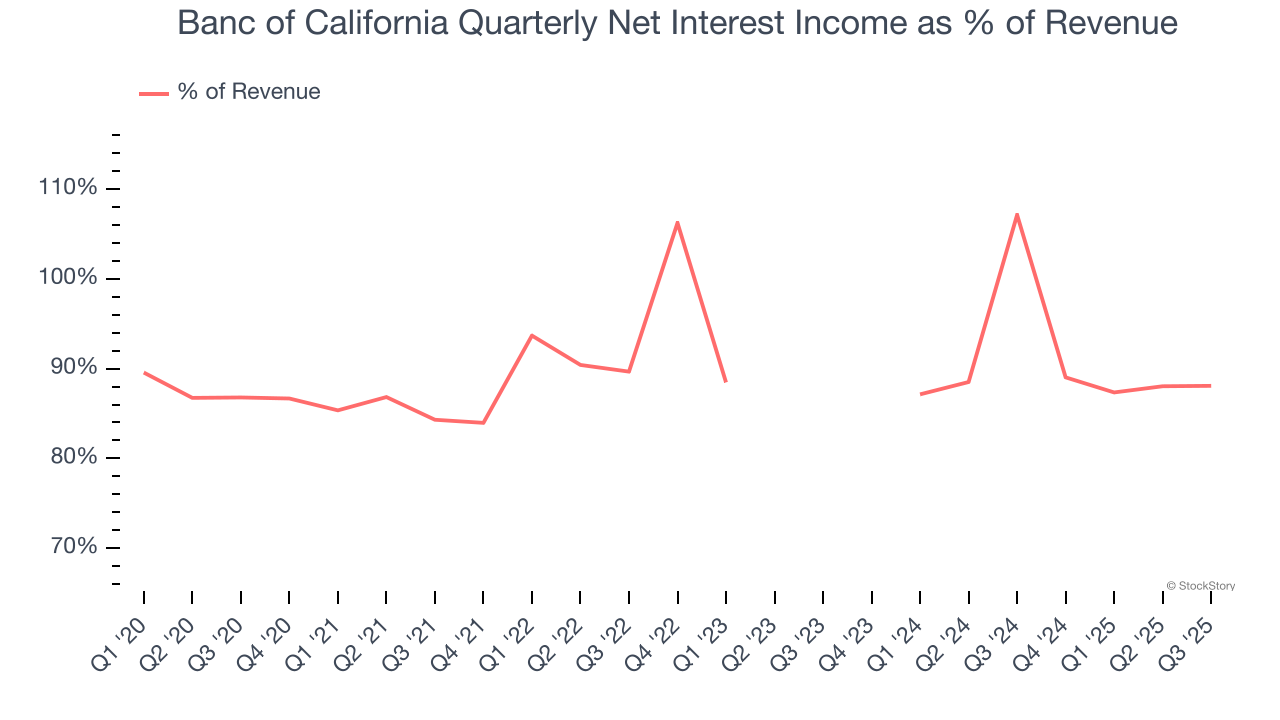
Net interest income made up 93.3% of the company’s total revenue during the last five years, meaning Banc of California lives and dies by its lending activities because non-interest income barely moves the needle.
 Note: Quarters not shown were determined to be outliers, impacted by outsized investment gains/losses that are not indicative of the recurring fundamentals of the business.
Net interest income commands greater market attention due to its reliability and consistency, whereas non-interest income is often seen as lower-quality revenue that lacks the same dependable characteristics.
Unless you’ve been living under a rock, it should be obvious by now that generative AI is going to have a huge impact on how large corporations do business. While Nvidia and AMD are trading close to all-time highs, we prefer a lesser-known (but still profitable) stock benefiting from the rise of AI. Click here to access our free report one of our favorites growth stories.
Tangible Book Value Per Share (TBVPS)
The balance sheet drives banking profitability since earnings flow from the spread between borrowing and lending rates. As such, valuations for these companies concentrate on capital strength and sustainable equity accumulation potential.
This is why we consider tangible book value per share (TBVPS) the most important metric to track for banks. TBVPS represents the real, liquid net worth per share of a bank, excluding intangible assets that have debatable value upon liquidation. Other (and more commonly known) per-share metrics like EPS can sometimes be murky due to M&A or accounting rules allowing for loan losses to be spread out.
Banc of California’s TBVPS declined at a 3.6% annual clip over the last five years. However, TBVPS growth has accelerated recently, growing by 3.6% annually over the last two years from $15.82 to $16.99 per share.
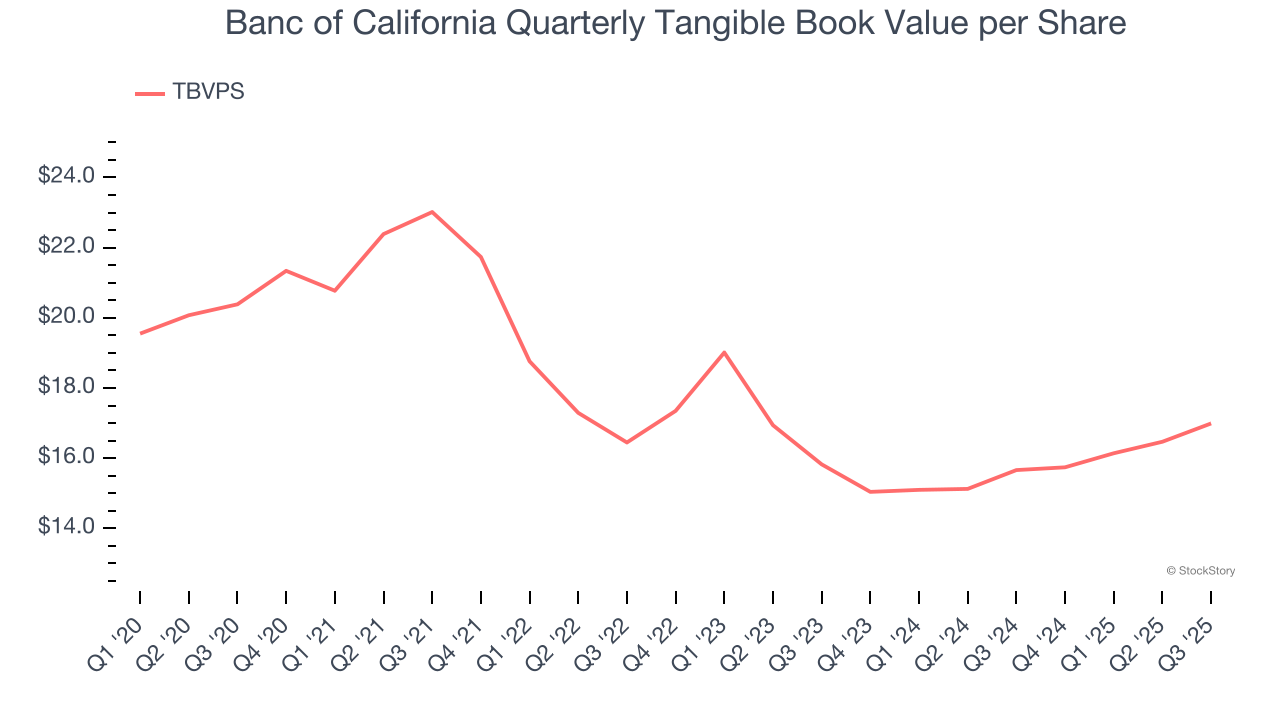
Over the next 12 months, Consensus estimates call for Banc of California’s TBVPS to grow by 6.6% to $18.12, mediocre growth rate.
Key Takeaways from Banc of California’s Q3 Results
It was good to see Banc of California beat analysts’ EPS expectations this quarter. We were also happy its revenue outperformed Wall Street’s estimates. Overall, we think this was a decent quarter with some key metrics above expectations. The stock traded up 3.6% to $17.49 immediately following the results.
Banc of California may have had a good quarter, but does that mean you should invest right now? When making that decision, it’s important to consider its valuation, business qualities, as well as what has happened in the latest quarter. We cover that in our actionable full research report which you can read here, it’s free for active Edge members.


