
Regional banking company First Merchants (NASDAQ: FRME) met Wall Street’s revenue expectations in Q3 CY2025, but sales fell by 2.8% year on year to $166.1 million. Its GAAP profit of $0.98 per share was 1.9% above analysts’ consensus estimates.
Is now the time to buy First Merchants? Find out by accessing our full research report, it’s free for active Edge members.
First Merchants (FRME) Q3 CY2025 Highlights:
- Net Interest Income: $133.7 million vs analyst estimates of $137.1 million (1.9% year-on-year growth, 2.5% miss)
- Net Interest Margin: 3.2% vs analyst estimates of 3.2% (2.4 basis point beat)
- Revenue: $166.1 million vs analyst estimates of $165.6 million (2.8% year-on-year decline, in line)
- Efficiency Ratio: 55.1% vs analyst estimates of 54.6% (53.4 basis point miss)
- EPS (GAAP): $0.98 vs analyst estimates of $0.96 (1.9% beat)
- Tangible Book Value per Share: $29.08 vs analyst estimates of $28.61 (9.5% year-on-year growth, 1.6% beat)
- Market Capitalization: $2.13 billion
"Our strong year-to-date balance sheet and earnings performance underscore the strength and resilience of our business model. Our return on assets, return on tangible capital, and efficiency ratio are in the top-quartile relative to our peers, reflecting disciplined execution and operational excellence," said Mark Hardwick, Chief Executive Officer.
Company Overview
Dating back to 1893 when it first opened its doors in Indiana, First Merchants (NASDAQ: FRME) is a Midwest regional bank providing commercial, consumer, and wealth management services through branches in Indiana, Ohio, Michigan, and Illinois.
Sales Growth
In general, banks make money from two primary sources. The first is net interest income, which is interest earned on loans, mortgages, and investments in securities minus interest paid out on deposits. The second source is non-interest income, which can come from bank account, credit card, wealth management, investing banking, and trading fees. Luckily, First Merchants’s revenue grew at a decent 6.6% compounded annual growth rate over the last five years. Its growth was slightly above the average banking company and shows its offerings resonate with customers.
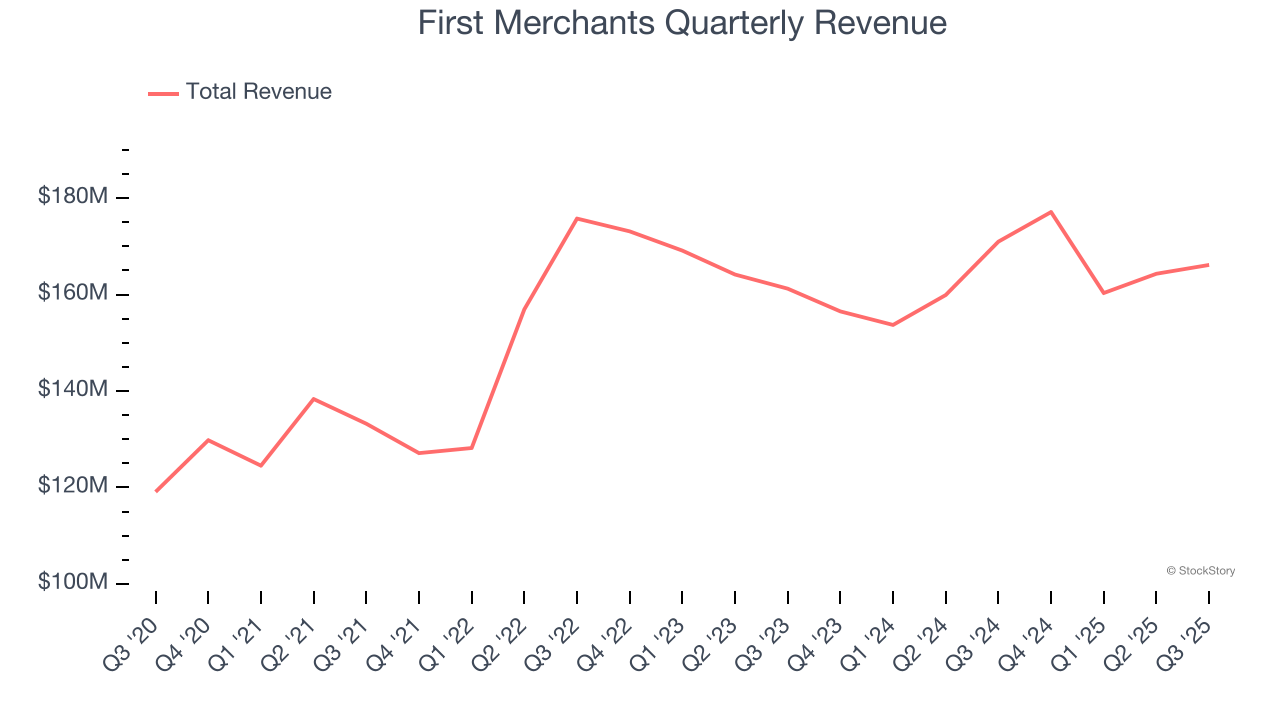
Long-term growth is the most important, but within financials, a half-decade historical view may miss recent interest rate changes and market returns. First Merchants’s recent performance shows its demand has slowed as its revenue was flat over the last two years. 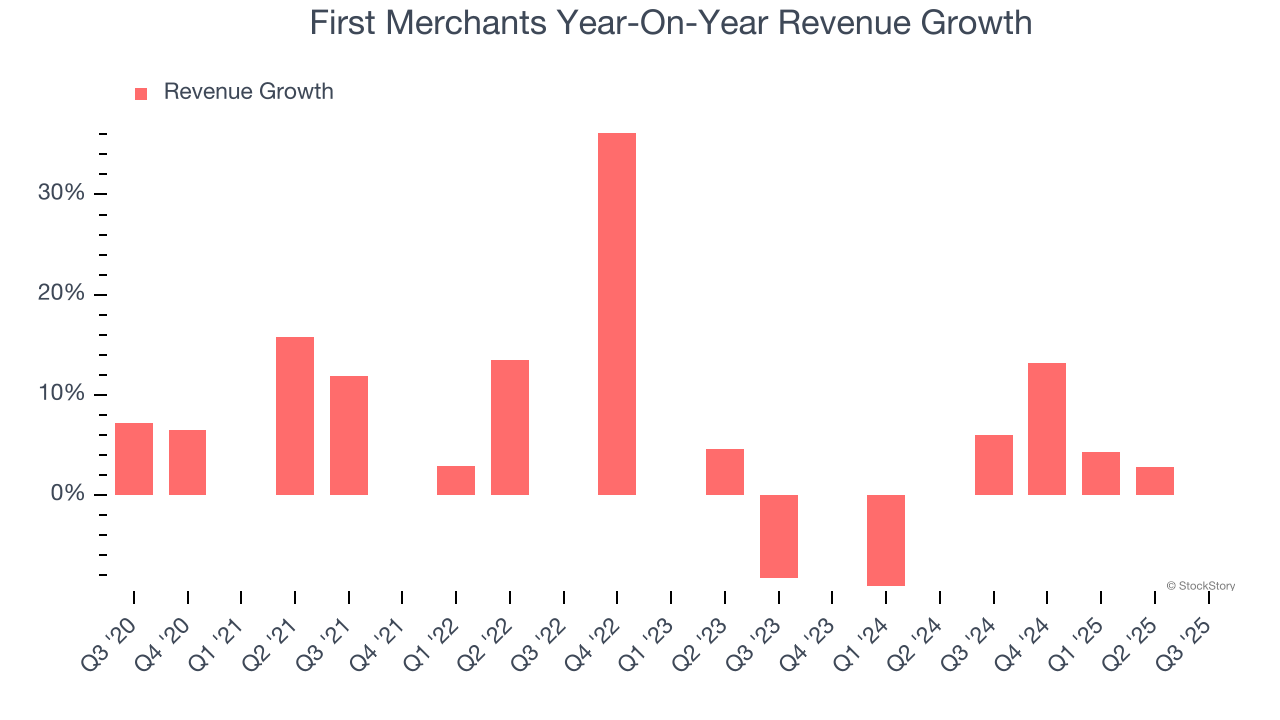 Note: Quarters not shown were determined to be outliers, impacted by outsized investment gains/losses that are not indicative of the recurring fundamentals of the business.
This quarter, First Merchants reported a rather uninspiring 2.8% year-on-year revenue decline to $166.1 million of revenue, in line with Wall Street’s estimates.
Net interest income made up 80.7% of the company’s total revenue during the last five years, meaning First Merchants barely relies on non-interest income to drive its overall growth.
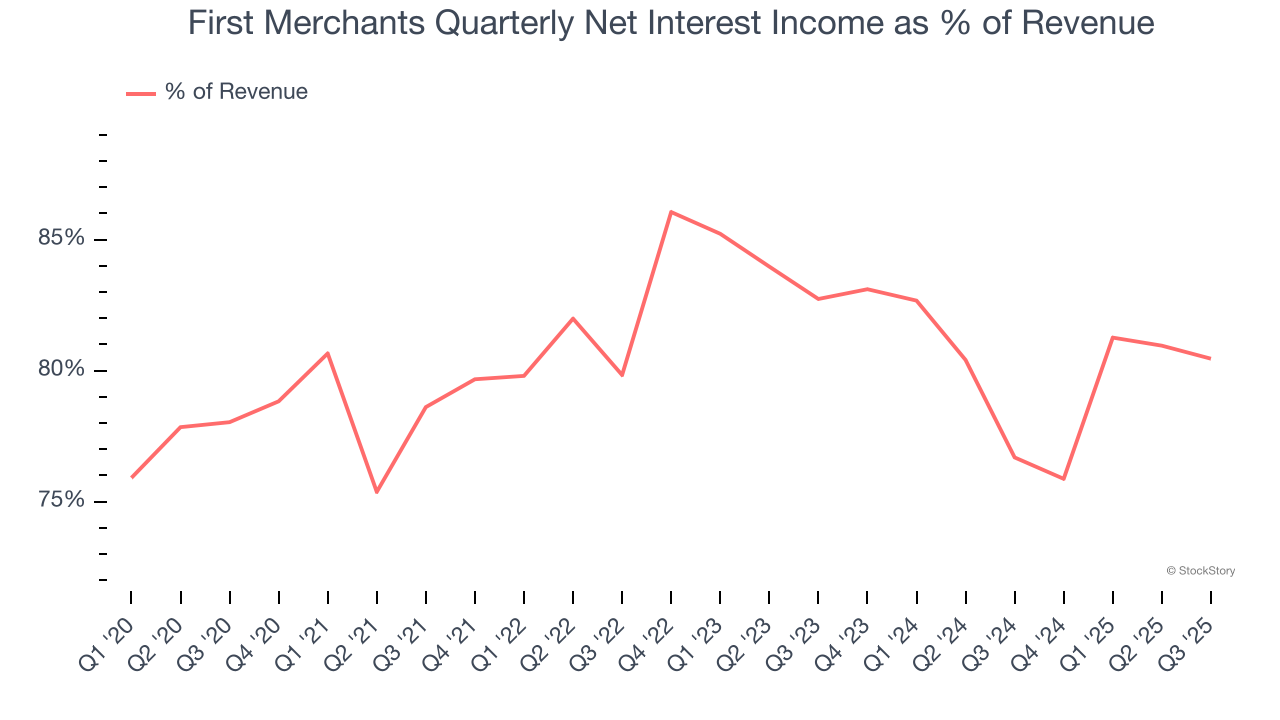
Markets consistently prioritize net interest income growth over fee-based revenue, recognizing its superior quality and recurring nature compared to the more unpredictable non-interest income streams.
Unless you’ve been living under a rock, it should be obvious by now that generative AI is going to have a huge impact on how large corporations do business. While Nvidia and AMD are trading close to all-time highs, we prefer a lesser-known (but still profitable) stock benefiting from the rise of AI. Click here to access our free report one of our favorites growth stories.
Tangible Book Value Per Share (TBVPS)
Banks operate as balance sheet businesses, with profits generated through borrowing and lending activities. Valuations reflect this reality, emphasizing balance sheet strength and long-term book value compounding ability.
This explains why tangible book value per share (TBVPS) stands as the premier banking metric. TBVPS strips away questionable intangible assets, revealing concrete per-share net worth that investors can trust. On the other hand, EPS is often distorted by mergers and flexible loan loss accounting. TBVPS provides clearer performance insights.
First Merchants’s TBVPS grew at a mediocre 4.5% annual clip over the last five years. However, TBVPS growth has accelerated recently, growing by 14.1% annually over the last two years from $22.33 to $29.08 per share.
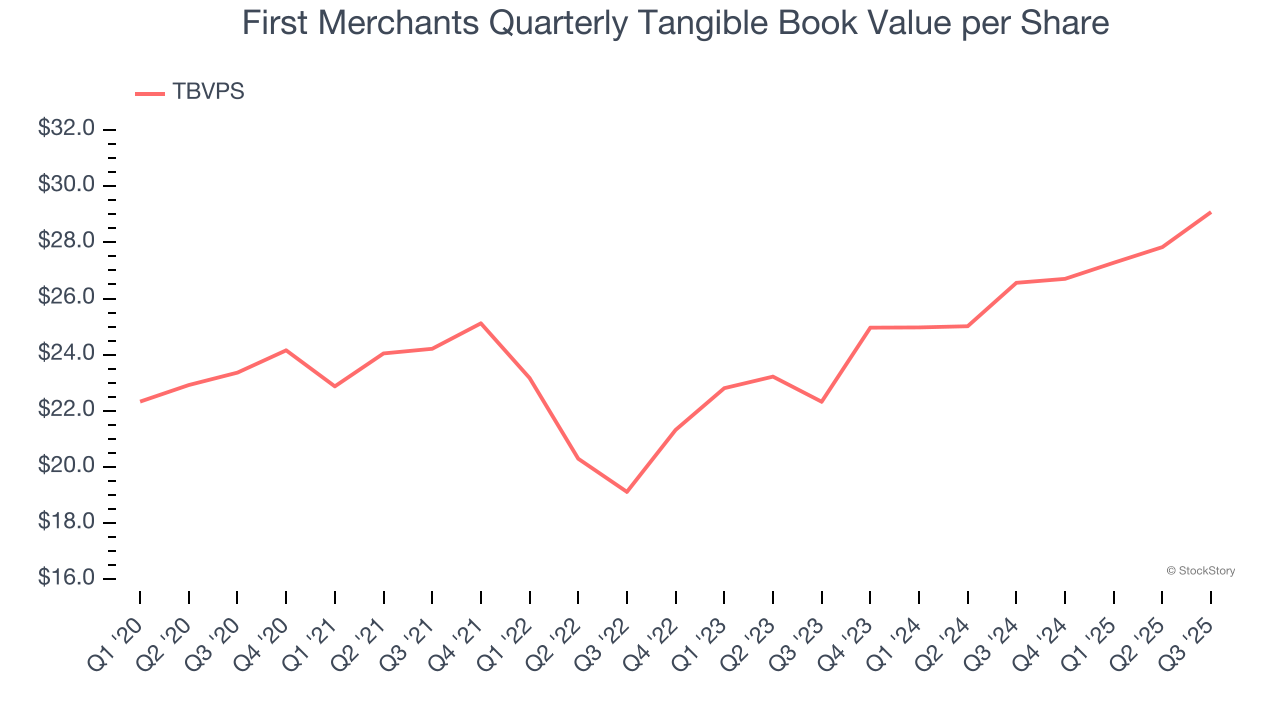
Over the next 12 months, Consensus estimates call for First Merchants’s TBVPS to grow by 2.5% to $29.81, paltry growth rate.
Key Takeaways from First Merchants’s Q3 Results
It was encouraging to see First Merchants beat analysts’ tangible book value per share expectations this quarter. On the other hand, its net interest income missed and its EPS slightly exceeded Wall Street’s estimates. Overall, this was a softer quarter. The stock remained flat at $36.61 immediately after reporting.
Is First Merchants an attractive investment opportunity at the current price? When making that decision, it’s important to consider its valuation, business qualities, as well as what has happened in the latest quarter. We cover that in our actionable full research report which you can read here, it’s free for active Edge members.