Climate control solutions innovator Lennox International (NYSE: LII) missed Wall Street’s revenue expectations in Q3 CY2025, with sales falling 4.8% year on year to $1.43 billion. Its non-GAAP profit of $6.98 per share was 2% above analysts’ consensus estimates.
Is now the time to buy Lennox? Find out by accessing our full research report, it’s free for active Edge members.
Lennox (LII) Q3 CY2025 Highlights:
- Revenue: $1.43 billion vs analyst estimates of $1.49 billion (4.8% year-on-year decline, 4.3% miss)
- Adjusted EPS: $6.98 vs analyst estimates of $6.84 (2% beat)
- Management lowered its full-year Adjusted EPS guidance to $23 at the midpoint, a 3.2% decrease
- Operating Margin: 21.7%, up from 20.2% in the same quarter last year
- Free Cash Flow Margin: 18.6%, down from 27.4% in the same quarter last year
- Organic Revenue fell 5% year on year vs analyst estimates of flat growth (445.3 basis point miss)
- Market Capitalization: $19.28 billion
"As anticipated, 2025 is proving to be a transitional year, shaped by the impact of the refrigerant transition and difficult macroeconomic conditions. During these uncertain times, the Lennox team continues to respond with agility and discipline, delivering margin expansion in both segments," said CEO, Alok Maskara.
Company Overview
Based in Texas and founded over a century ago, Lennox (NYSE: LII) is a climate control solutions company offering heating, ventilation, air conditioning, and refrigeration (HVACR) goods.
Revenue Growth
A company’s long-term sales performance can indicate its overall quality. Any business can experience short-term success, but top-performing ones enjoy sustained growth for years. Thankfully, Lennox’s 8.2% annualized revenue growth over the last five years was decent. Its growth was slightly above the average industrials company and shows its offerings resonate with customers.
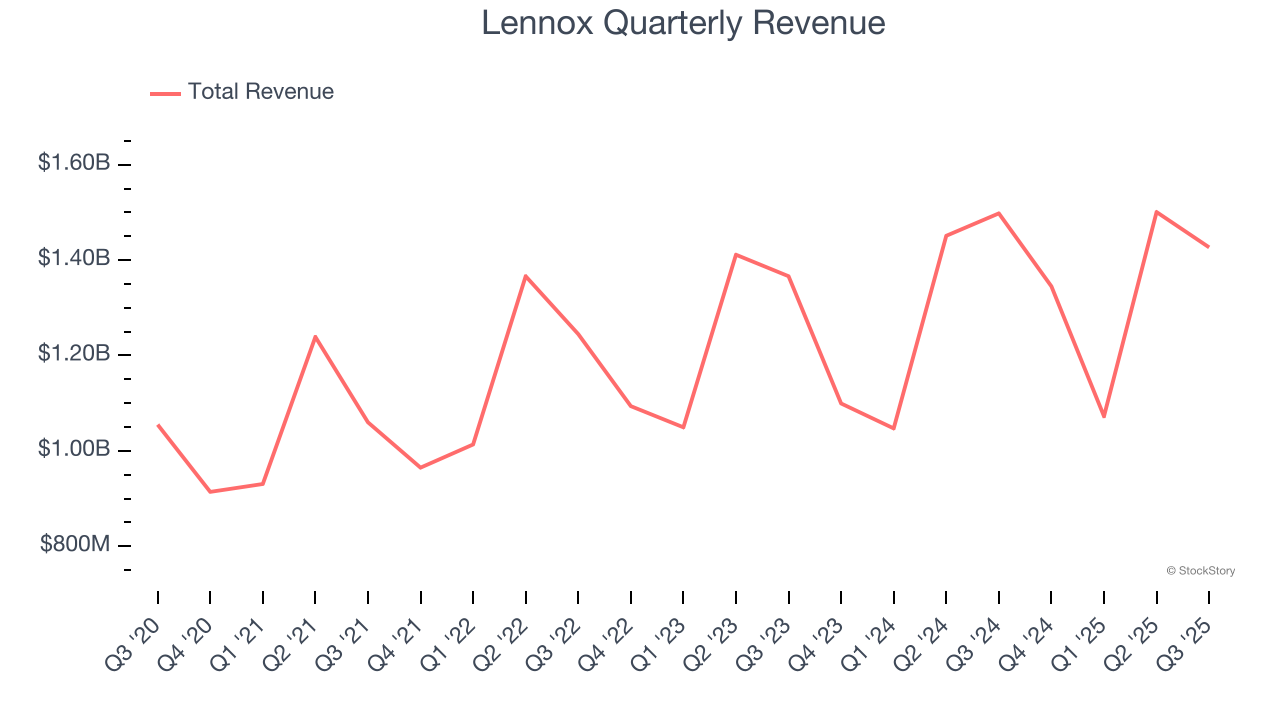
We at StockStory place the most emphasis on long-term growth, but within industrials, a half-decade historical view may miss cycles, industry trends, or a company capitalizing on catalysts such as a new contract win or a successful product line. Lennox’s recent performance shows its demand has slowed as its annualized revenue growth of 4.2% over the last two years was below its five-year trend. 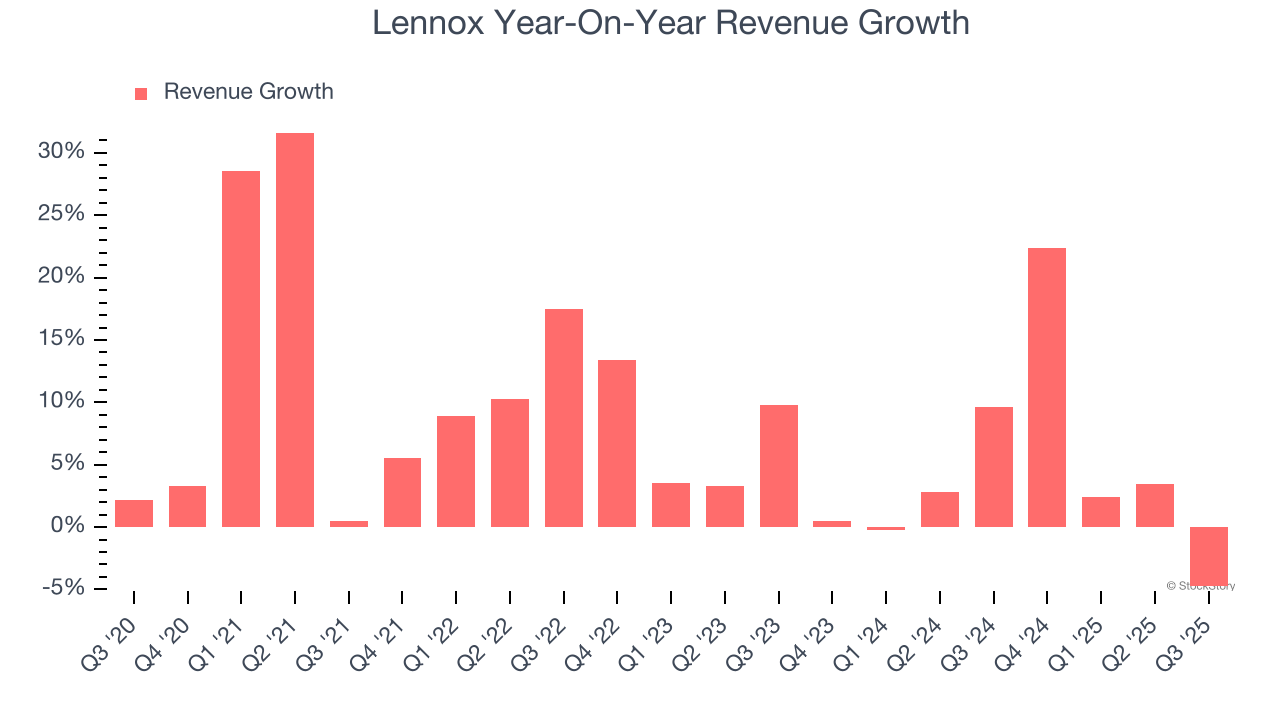
Lennox also reports organic revenue, which strips out one-time events like acquisitions and currency fluctuations that don’t accurately reflect its fundamentals. Over the last two years, Lennox’s organic revenue averaged 6.4% year-on-year growth. Because this number is better than its two-year revenue growth, we can see that some mixture of divestitures and foreign exchange rates dampened its headline results. 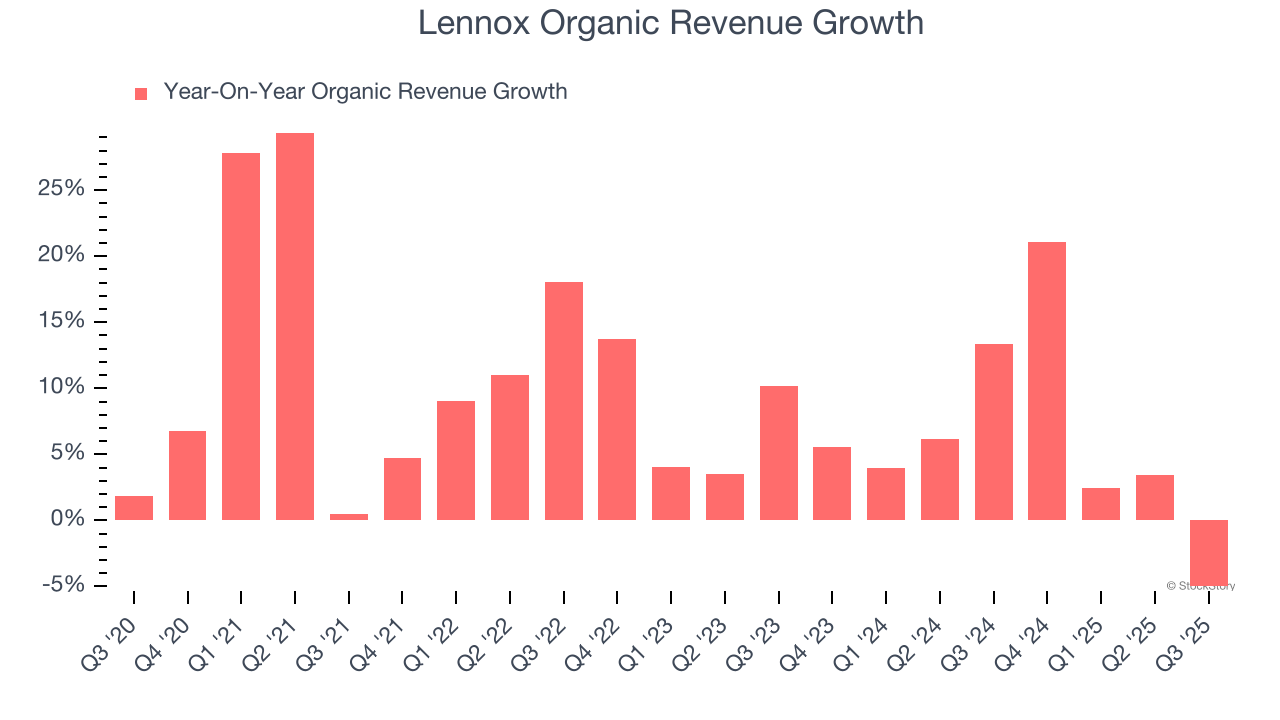
This quarter, Lennox missed Wall Street’s estimates and reported a rather uninspiring 4.8% year-on-year revenue decline, generating $1.43 billion of revenue.
Looking ahead, sell-side analysts expect revenue to grow 6.1% over the next 12 months. Although this projection suggests its newer products and services will spur better top-line performance, it is still below average for the sector. At least the company is tracking well in other measures of financial health.
Unless you’ve been living under a rock, it should be obvious by now that generative AI is going to have a huge impact on how large corporations do business. While Nvidia and AMD are trading close to all-time highs, we prefer a lesser-known (but still profitable) stock benefiting from the rise of AI. Click here to access our free report one of our favorites growth stories.
Operating Margin
Operating margin is one of the best measures of profitability because it tells us how much money a company takes home after procuring and manufacturing its products, marketing and selling those products, and most importantly, keeping them relevant through research and development.
Lennox has been a well-oiled machine over the last five years. It demonstrated elite profitability for an industrials business, boasting an average operating margin of 16.7%.
Analyzing the trend in its profitability, Lennox’s operating margin rose by 4.7 percentage points over the last five years, as its sales growth gave it operating leverage.
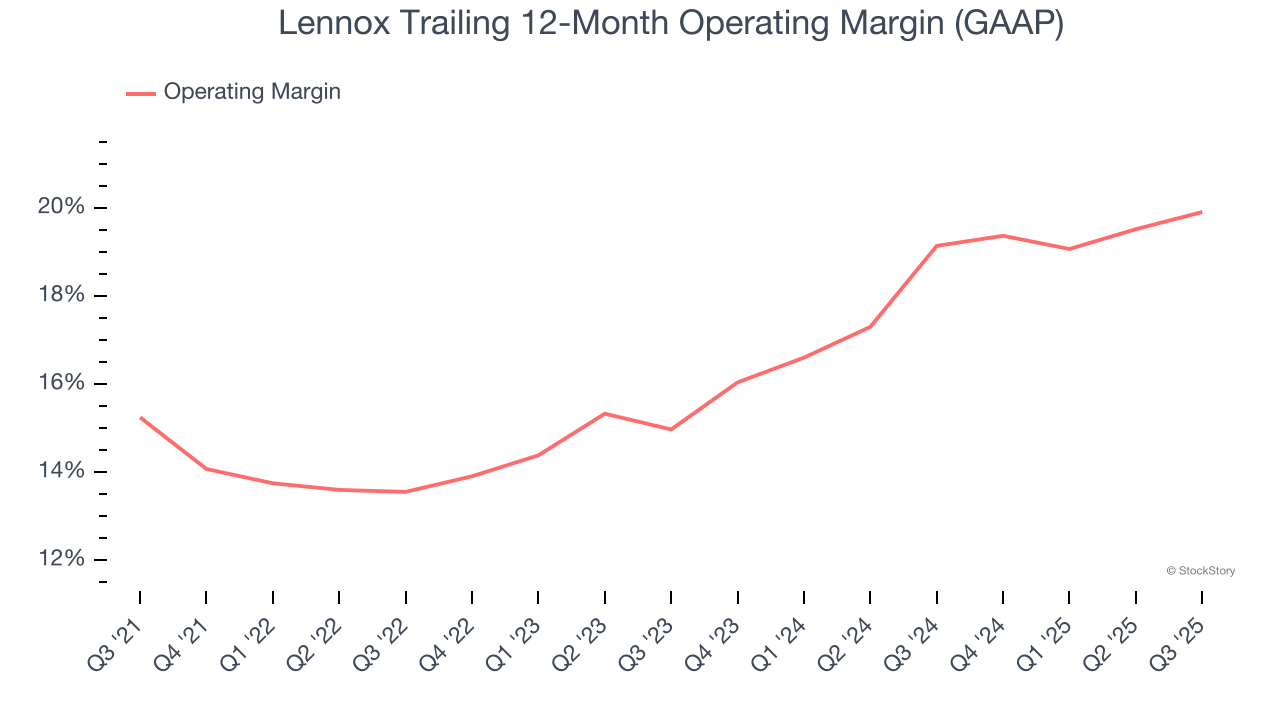
In Q3, Lennox generated an operating margin profit margin of 21.7%, up 1.5 percentage points year on year. The increase was encouraging, and because its operating margin rose more than its gross margin, we can infer it was more efficient with expenses such as marketing, R&D, and administrative overhead.
Earnings Per Share
We track the long-term change in earnings per share (EPS) for the same reason as long-term revenue growth. Compared to revenue, however, EPS highlights whether a company’s growth is profitable.
Lennox’s EPS grew at an astounding 20.1% compounded annual growth rate over the last five years, higher than its 8.2% annualized revenue growth. This tells us the company became more profitable on a per-share basis as it expanded.
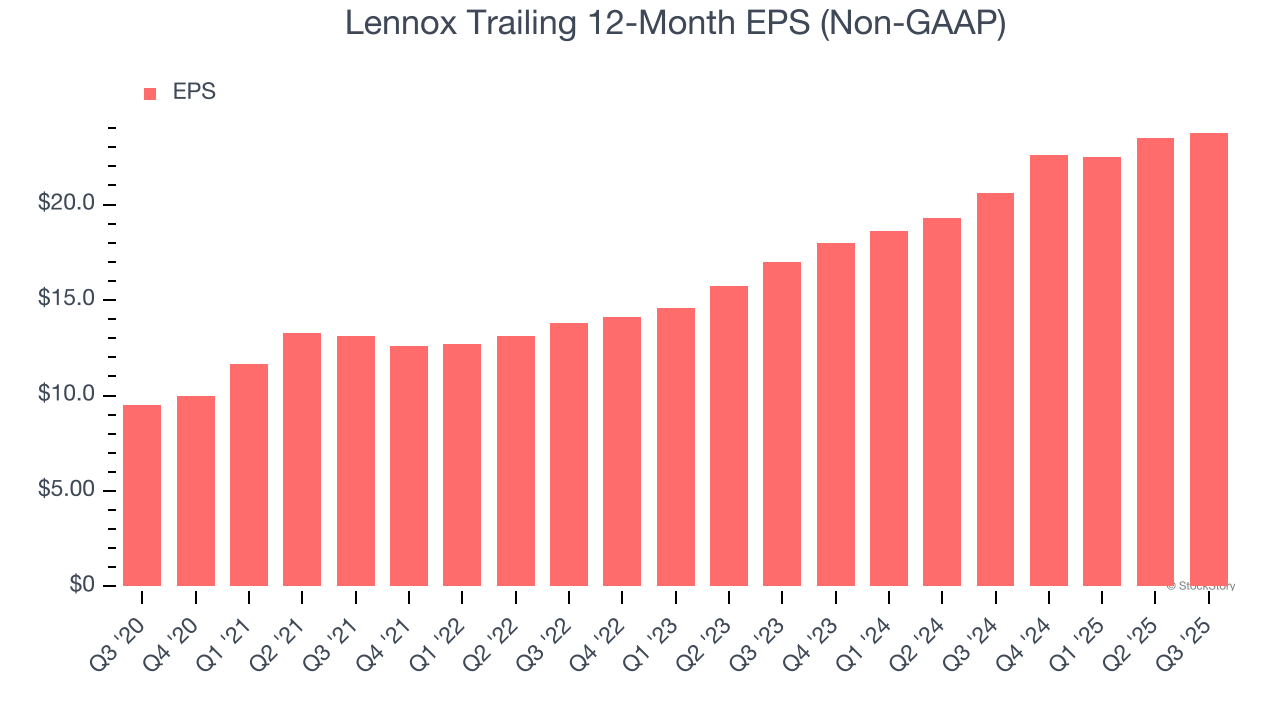
Diving into Lennox’s quality of earnings can give us a better understanding of its performance. As we mentioned earlier, Lennox’s operating margin expanded by 4.7 percentage points over the last five years. On top of that, its share count shrank by 8.8%. These are positive signs for shareholders because improving profitability and share buybacks turbocharge EPS growth relative to revenue growth. 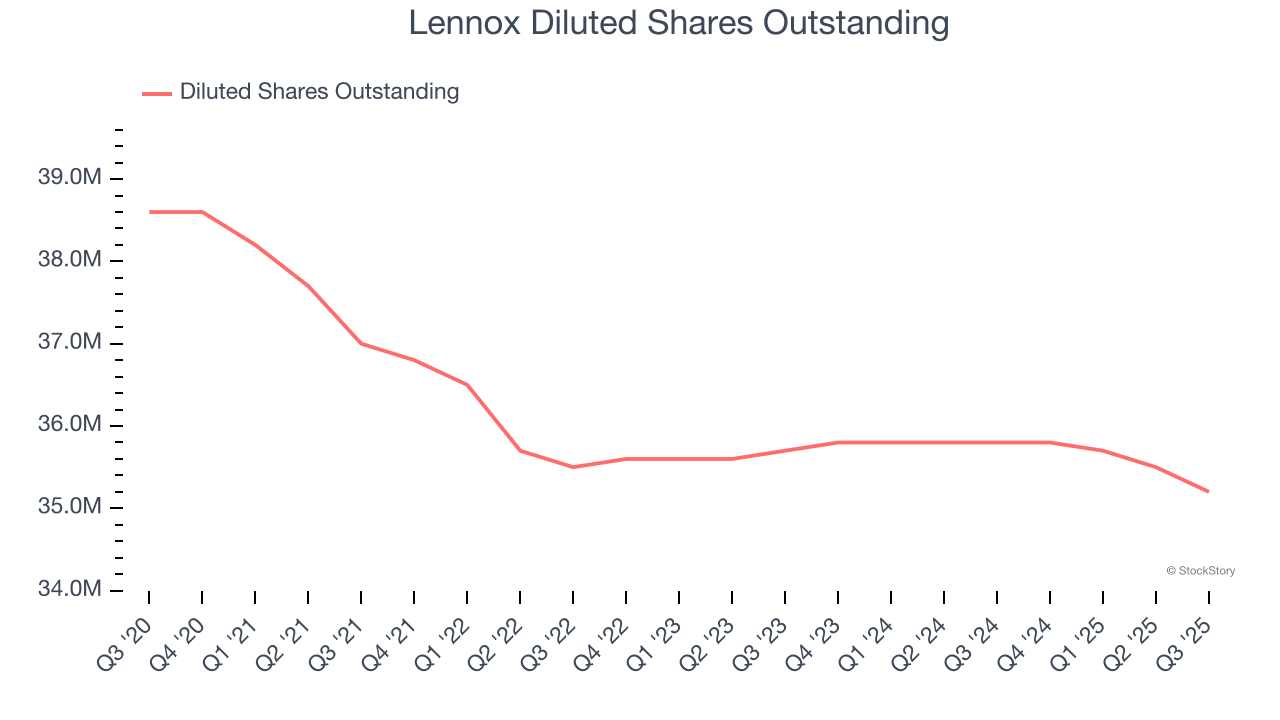
Like with revenue, we analyze EPS over a more recent period because it can provide insight into an emerging theme or development for the business.
For Lennox, its two-year annual EPS growth of 18.3% was lower than its five-year trend. We still think its growth was good and hope it can accelerate in the future.
In Q3, Lennox reported adjusted EPS of $6.98, up from $6.68 in the same quarter last year. This print beat analysts’ estimates by 2%. Over the next 12 months, Wall Street expects Lennox’s full-year EPS of $23.77 to grow 7.7%.
Key Takeaways from Lennox’s Q3 Results
We struggled to find many positives in these results. Its revenue missed and its organic revenue fell short of Wall Street’s estimates. Overall, this was a softer quarter. The stock traded down 1.7% to $540 immediately after reporting.
Lennox’s latest earnings report disappointed. One quarter doesn’t define a company’s quality, so let’s explore whether the stock is a buy at the current price. We think that the latest quarter is only one piece of the longer-term business quality puzzle. Quality, when combined with valuation, can help determine if the stock is a buy. We cover that in our actionable full research report which you can read here, it’s free for active Edge members.


