
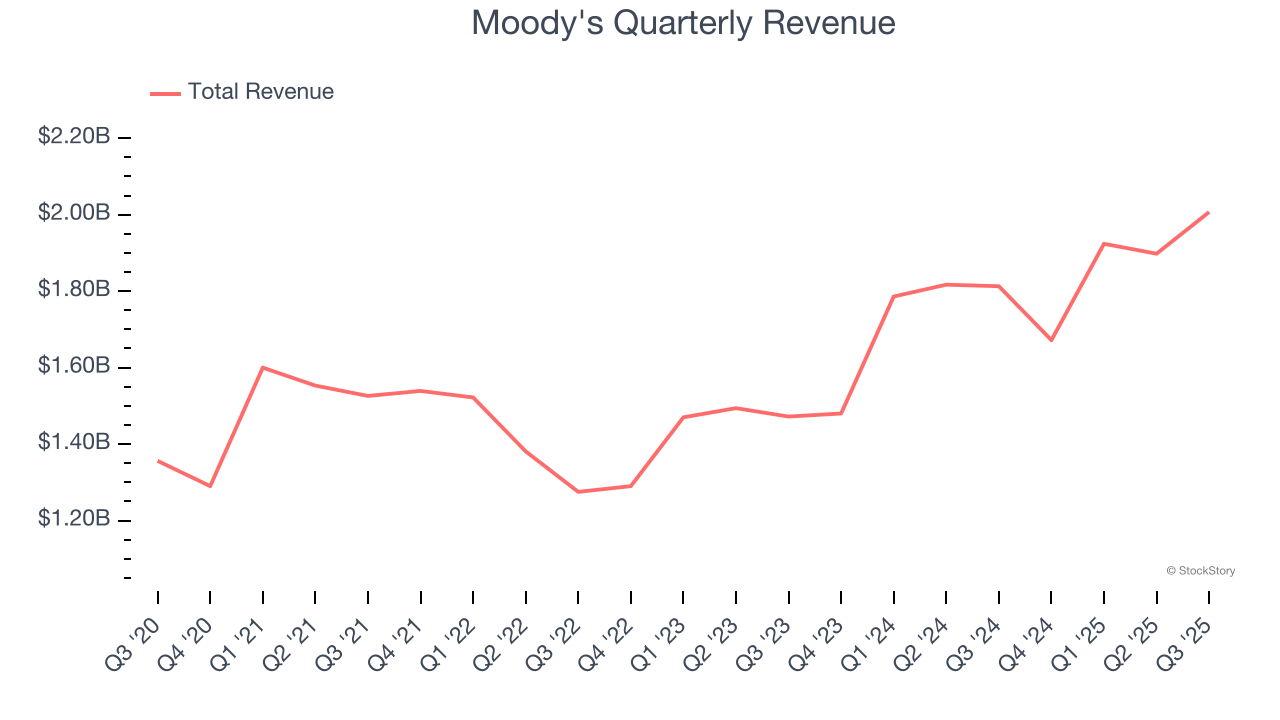
Credit rating agency Moody's (NYSE: MCO) announced better-than-expected revenue in Q3 CY2025, with sales up 10.7% year on year to $2.01 billion. Its non-GAAP profit of $3.92 per share was 6.4% above analysts’ consensus estimates.
Is now the time to buy Moody's? Find out by accessing our full research report, it’s free for active Edge members.
Moody's (MCO) Q3 CY2025 Highlights:
- Revenue: $2.01 billion vs analyst estimates of $1.96 billion (10.7% year-on-year growth, 2.4% beat)
- Pre-tax Profit: $867 million (43.2% margin, 23.3% year-on-year growth)
- Adjusted EPS: $3.92 vs analyst estimates of $3.68 (6.4% beat)
- Adjusted EPS guidance for the full year is $14.63 at the midpoint, beating analyst estimates by 3.6%
- Market Capitalization: $86.99 billion
Company Overview
Founded in 1900 during America's railroad boom when investors needed reliable information on bond risks, Moody's (NYSE: MCO) provides credit ratings, risk assessment tools, and analytical solutions that help organizations evaluate financial risks and make informed investment decisions.
Revenue Growth
A company’s long-term sales performance is one signal of its overall quality. Any business can experience short-term success, but top-performing ones enjoy sustained growth for years. Regrettably, Moody’s revenue grew at a mediocre 7.1% compounded annual growth rate over the last five years. This wasn’t a great result compared to the rest of the financials sector, but there are still things to like about Moody's.
Long-term growth is the most important, but within financials, a half-decade historical view may miss recent interest rate changes and market returns. Moody’s annualized revenue growth of 14.5% over the last two years is above its five-year trend, suggesting its demand recently accelerated. 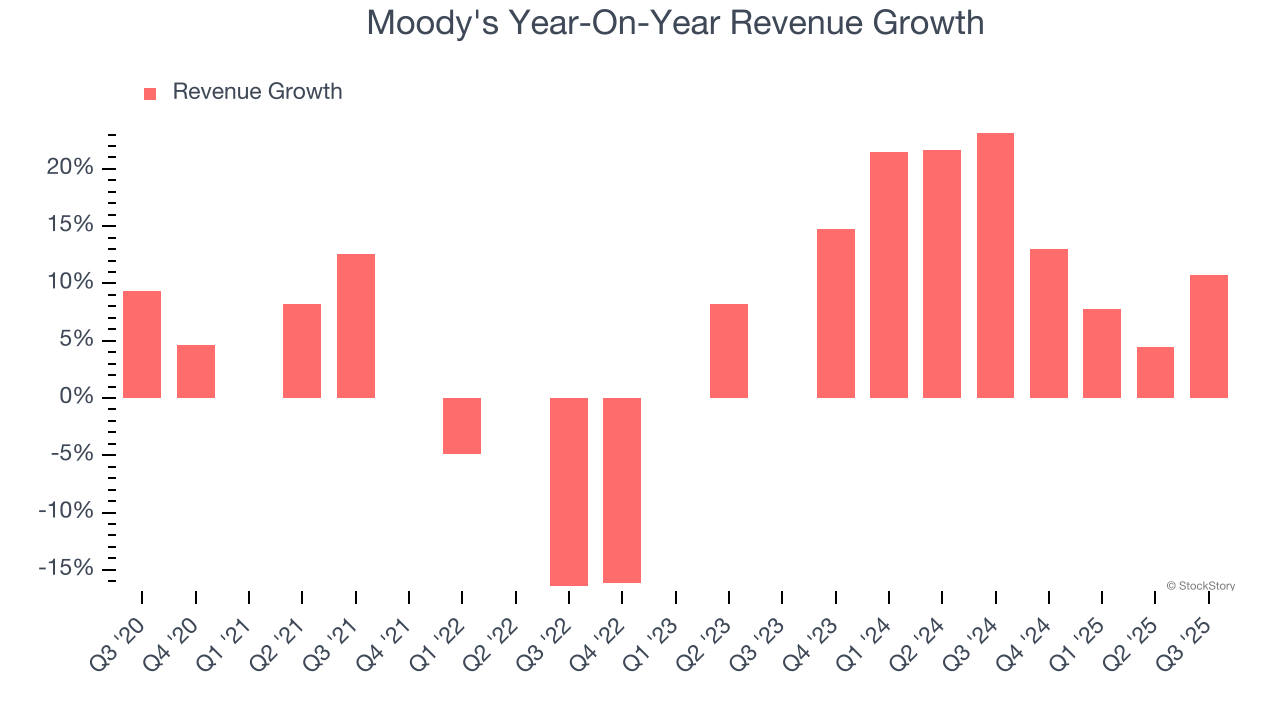 Note: Quarters not shown were determined to be outliers, impacted by outsized investment gains/losses that are not indicative of the recurring fundamentals of the business.
This quarter, Moody's reported year-on-year revenue growth of 10.7%, and its $2.01 billion of revenue exceeded Wall Street’s estimates by 2.4%.
Software is eating the world and there is virtually no industry left that has been untouched by it. That drives increasing demand for tools helping software developers do their jobs, whether it be monitoring critical cloud infrastructure, integrating audio and video functionality, or ensuring smooth content streaming. Click here to access a free report on our 3 favorite stocks to play this generational megatrend.
Key Takeaways from Moody’s Q3 Results
It was great to see Moody’s full-year EPS guidance top analysts’ expectations. We were also happy its revenue outperformed Wall Street’s estimates. Overall, we think this was a decent quarter with some key metrics above expectations. The stock remained flat at $480.13 immediately after reporting.
Big picture, is Moody's a buy here and now? The latest quarter does matter, but not nearly as much as longer-term fundamentals and valuation, when deciding if the stock is a buy. We cover that in our actionable full research report which you can read here, it’s free for active Edge members.


