
Puerto Rican financial services company OFG Bancorp (NYSE: OFG) missed Wall Street’s revenue expectations in Q3 CY2025, but sales rose 5.3% year on year to $184 million. Its GAAP profit of $1.16 per share was 0.9% below analysts’ consensus estimates.
Is now the time to buy OFG Bancorp? Find out by accessing our full research report, it’s free for active Edge members.
OFG Bancorp (OFG) Q3 CY2025 Highlights:
- Net Interest Income: $154.7 million vs analyst estimates of $156.3 million (4.6% year-on-year growth, 1% miss)
- Net Interest Margin: 5.2% vs analyst estimates of 5.3% (6 basis point miss)
- Revenue: $184 million vs analyst estimates of $187 million (5.3% year-on-year growth, 1.6% miss)
- Efficiency Ratio: 52.5% vs analyst estimates of 51.5% (100.5 basis point miss)
- EPS (GAAP): $1.16 vs analyst expectations of $1.17 (0.9% miss)
- Tangible Book Value per Share: $28.92 vs analyst estimates of $28.44 (10.6% year-on-year growth, 1.7% beat)
- Market Capitalization: $1.88 billion
Company Overview
Originally founded in 1964 as a federal savings and loan institution, OFG Bancorp (NYSE: OFG) provides banking and financial services including commercial and consumer lending, wealth management, insurance, and trust services primarily in Puerto Rico and the U.S. Virgin Islands.
Sales Growth
Net interest income and and fee-based revenue are the two pillars supporting bank earnings. The former captures profit from the gap between lending rates and deposit costs, while the latter encompasses charges for banking services, credit products, wealth management, and trading activities. Over the last five years, OFG Bancorp grew its revenue at a decent 6.4% compounded annual growth rate. Its growth was slightly above the average banking company and shows its offerings resonate with customers.
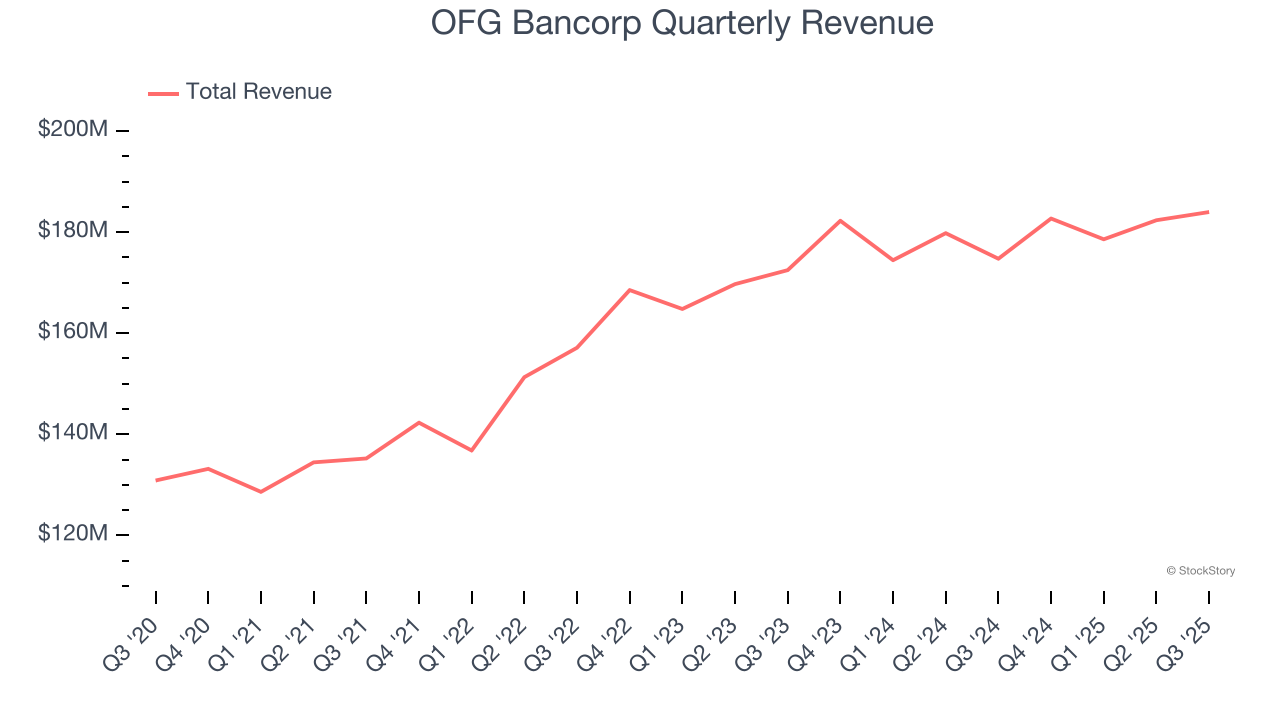
Long-term growth is the most important, but within financials, a half-decade historical view may miss recent interest rate changes and market returns. OFG Bancorp’s recent performance shows its demand has slowed as its annualized revenue growth of 3.8% over the last two years was below its five-year trend. 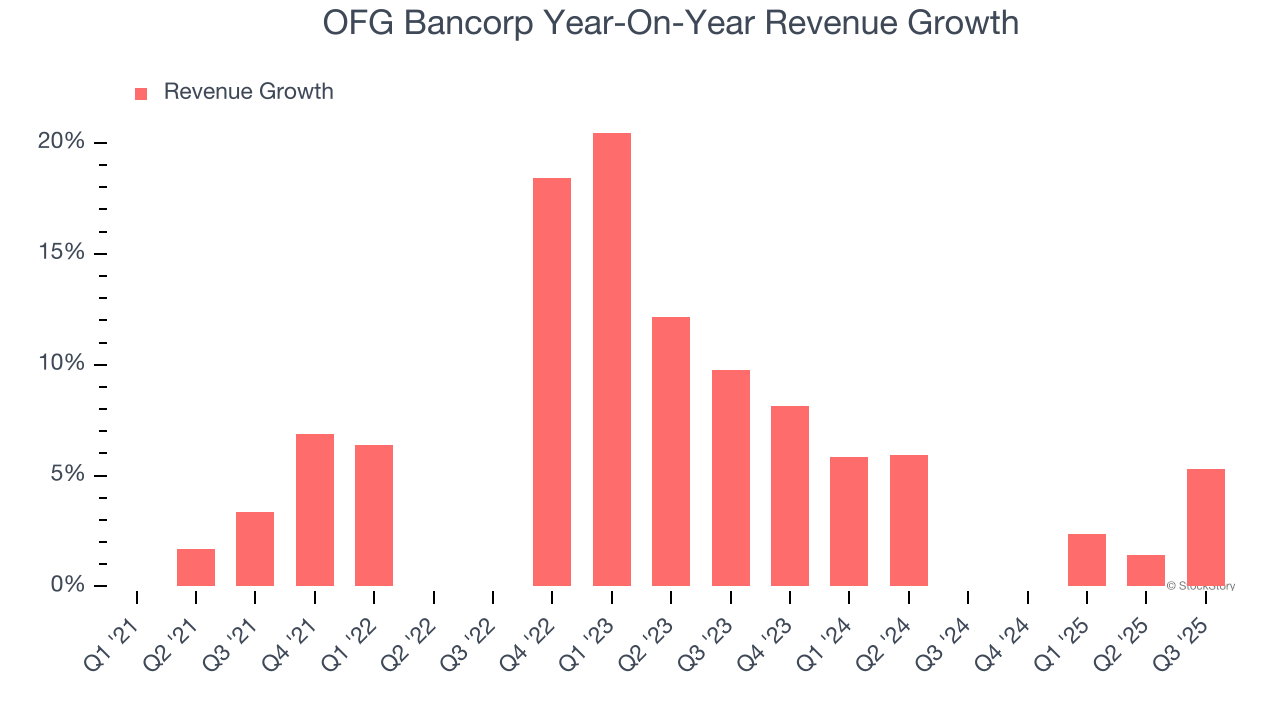 Note: Quarters not shown were determined to be outliers, impacted by outsized investment gains/losses that are not indicative of the recurring fundamentals of the business.
This quarter, OFG Bancorp’s revenue grew by 5.3% year on year to $184 million, missing Wall Street’s estimates.
Net interest income made up 79.8% of the company’s total revenue during the last five years, meaning lending operations are OFG Bancorp’s largest source of revenue.
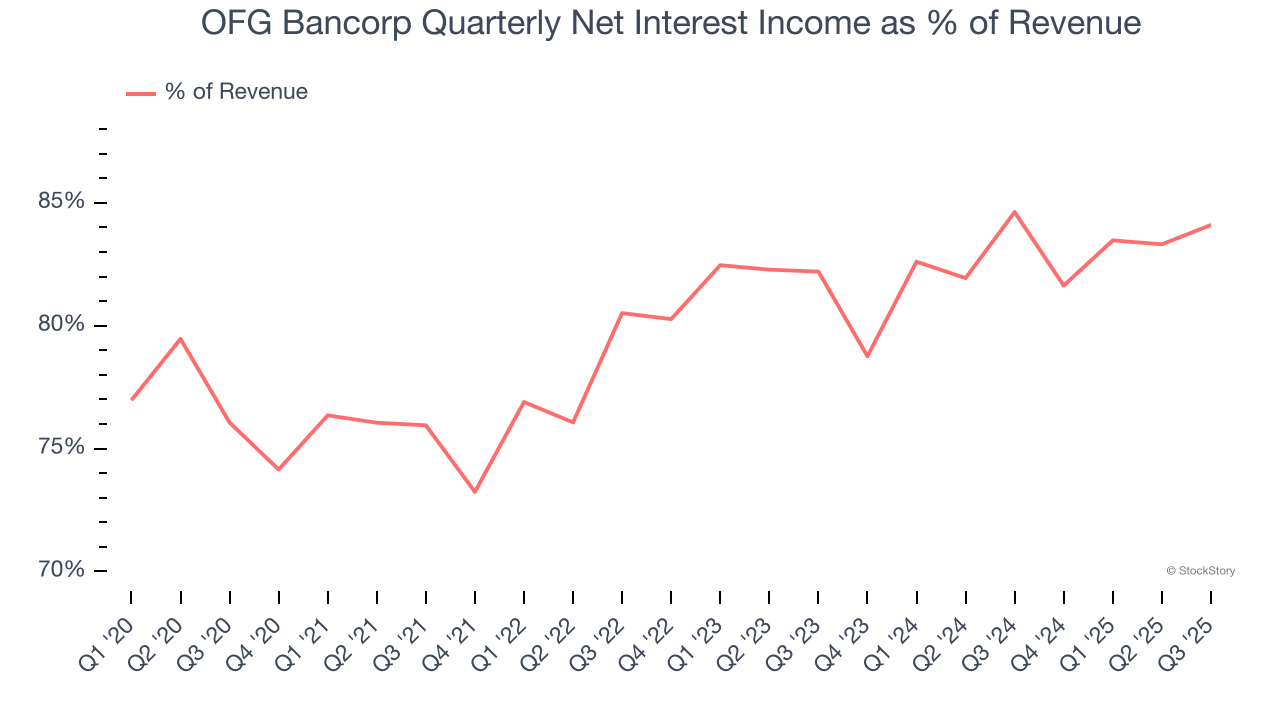
Markets consistently prioritize net interest income growth over fee-based revenue, recognizing its superior quality and recurring nature compared to the more unpredictable non-interest income streams.
Here at StockStory, we certainly understand the potential of thematic investing. Diverse winners from Microsoft (MSFT) to Alphabet (GOOG), Coca-Cola (KO) to Monster Beverage (MNST) could all have been identified as promising growth stories with a megatrend driving the growth. So, in that spirit, we’ve identified a relatively under-the-radar profitable growth stock benefiting from the rise of AI, available to you FREE via this link.
Tangible Book Value Per Share (TBVPS)
Banks are balance sheet-driven businesses because they generate earnings primarily through borrowing and lending. They’re also valued based on their balance sheet strength and ability to compound book value (another name for shareholders’ equity) over time.
This explains why tangible book value per share (TBVPS) stands as the premier banking metric. TBVPS strips away questionable intangible assets, revealing concrete per-share net worth that investors can trust. Other (and more commonly known) per-share metrics like EPS can sometimes be murky due to M&A or accounting rules allowing for loan losses to be spread out.
OFG Bancorp’s TBVPS grew at an incredible 12.1% annual clip over the last five years. TBVPS growth has also accelerated recently, growing by 17.3% annually over the last two years from $21.01 to $28.92 per share.
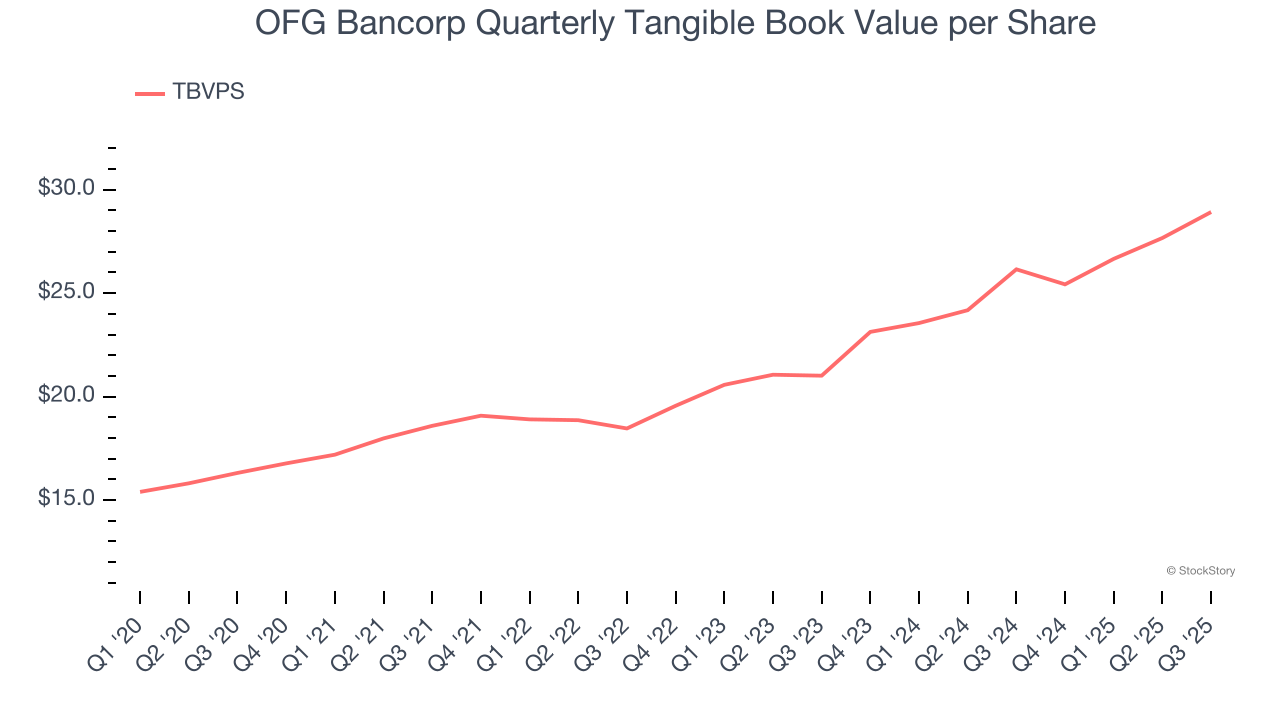
Over the next 12 months, Consensus estimates call for OFG Bancorp’s TBVPS to grow by 8.8% to $31.47, decent growth rate.
Key Takeaways from OFG Bancorp’s Q3 Results
It was encouraging to see OFG Bancorp beat analysts’ tangible book value per share expectations this quarter. On the other hand, its revenue missed and its EPS fell a bit short of Wall Street’s estimates. Overall, this was a weaker quarter. The stock traded down 4.6% to $40.22 immediately following the results.
OFG Bancorp didn’t show it’s best hand this quarter, but does that create an opportunity to buy the stock right now? When making that decision, it’s important to consider its valuation, business qualities, as well as what has happened in the latest quarter. We cover that in our actionable full research report which you can read here, it’s free for active Edge members.


