
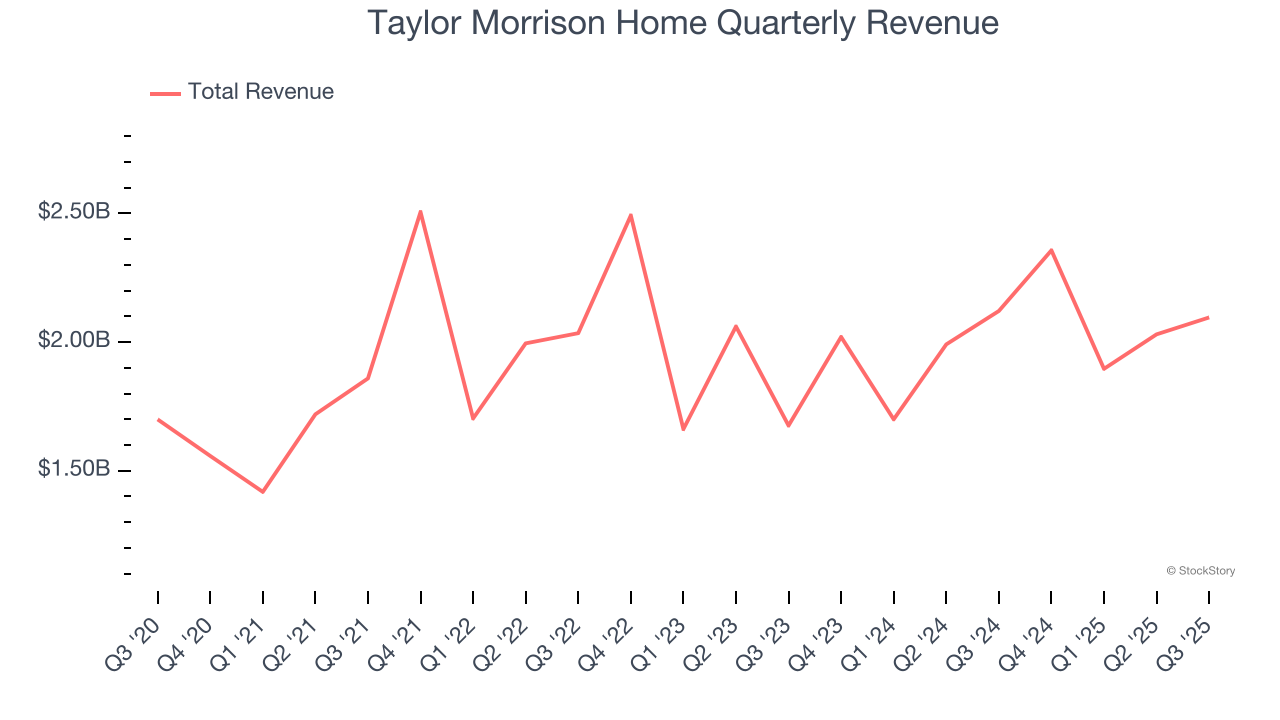
Homebuilder Taylor Morrison Home (NYSE: TMHC) reported Q3 CY2025 results topping the market’s revenue expectations, but sales fell by 1.2% year on year to $2.10 billion. Its non-GAAP profit of $2.11 per share was 9.8% above analysts’ consensus estimates.
Is now the time to buy Taylor Morrison Home? Find out by accessing our full research report, it’s free for active Edge members.
Taylor Morrison Home (TMHC) Q3 CY2025 Highlights:
- Revenue: $2.10 billion vs analyst estimates of $2.03 billion (1.2% year-on-year decline, 3.4% beat)
- Adjusted EPS: $2.11 vs analyst estimates of $1.92 (9.8% beat)
- Adjusted EBITDA: $333.1 million vs analyst estimates of $279 million (15.9% margin, 19.4% beat)
- Operating Margin: 13%, down from 15.7% in the same quarter last year
- Backlog: $2.34 billion at quarter end, down 39% year on year
- Market Capitalization: $6.19 billion
"We are pleased to report strong third quarter results despite the continuation of challenging market conditions. Driven by our diversified portfolio and team's careful calibration of inventory, pricing and pace across our well-located communities, we once again met or exceeded our guidance on all key metrics, including home closings volume, price and gross margin. The ongoing execution of our balanced operating strategy has allowed us to maintain healthy performance even as we have adjusted pricing and incentives, particularly in entry-level price points. Combined with a thoughtful approach to land-lighter financing tools and effective cost management, our business is generating strong bottom-line earnings, cash flow and returns for our shareholders," said Sheryl Palmer, Taylor Morrison CEO and Chairman.
Company Overview
Named “America’s Most Trusted Home Builder” in 2019, Taylor Morrison Home (NYSE: TMHC) builds single family homes and communities across the United States.
Revenue Growth
A company’s long-term sales performance can indicate its overall quality. Any business can experience short-term success, but top-performing ones enjoy sustained growth for years. Over the last five years, Taylor Morrison Home grew its sales at a mediocre 6.8% compounded annual growth rate. This was below our standard for the industrials sector and is a rough starting point for our analysis.
Long-term growth is the most important, but within industrials, a half-decade historical view may miss new industry trends or demand cycles. Taylor Morrison Home’s recent performance shows its demand has slowed as its annualized revenue growth of 3% over the last two years was below its five-year trend. 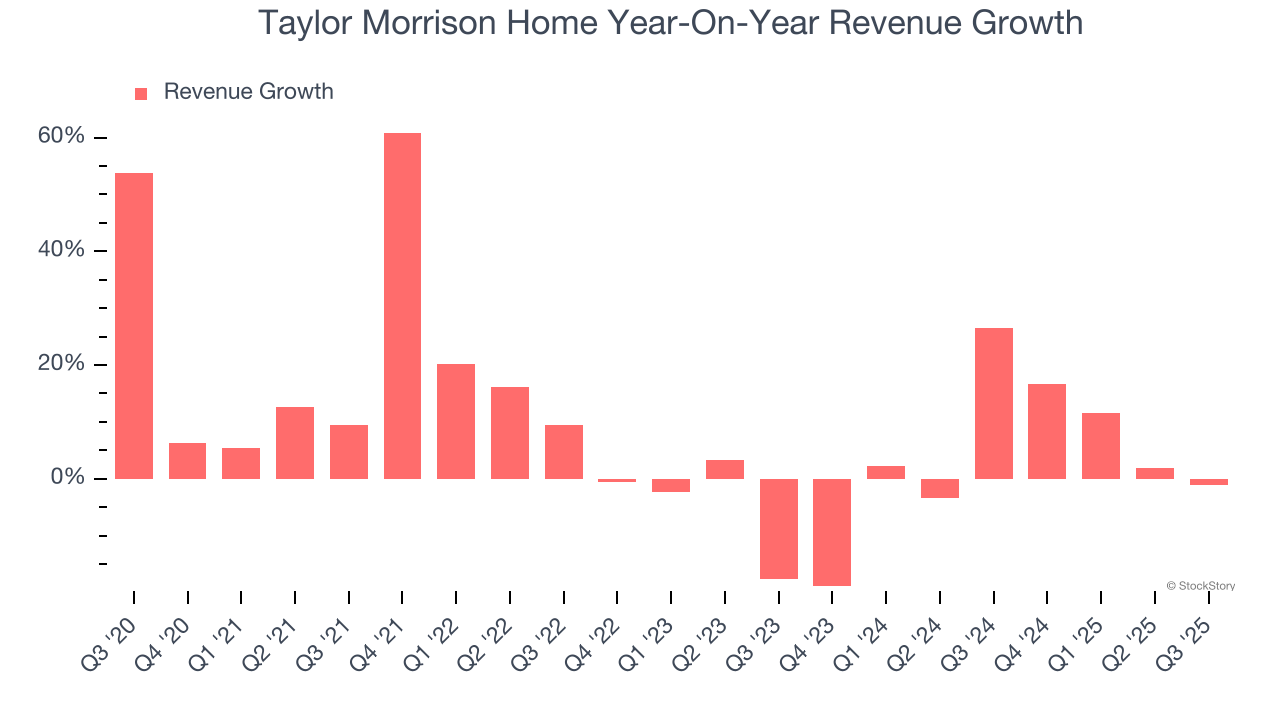
We can dig further into the company’s revenue dynamics by analyzing its backlog, or the value of its outstanding orders that have not yet been executed or delivered. Taylor Morrison Home’s backlog reached $2.34 billion in the latest quarter and averaged 14.5% year-on-year declines over the last two years. Because this number is lower than its revenue growth, we can see the company hasn’t secured enough new orders to maintain its growth rate in the future. 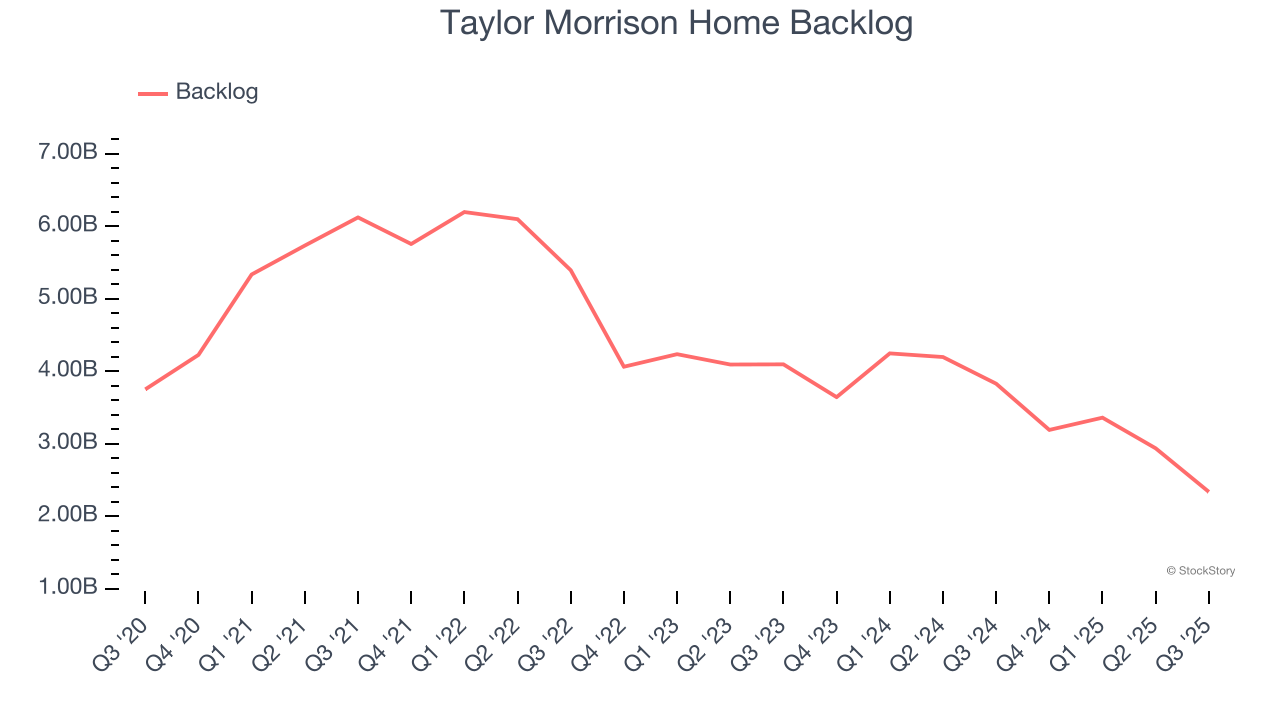
This quarter, Taylor Morrison Home’s revenue fell by 1.2% year on year to $2.10 billion but beat Wall Street’s estimates by 3.4%.
Looking ahead, sell-side analysts expect revenue to decline by 8.2% over the next 12 months, a deceleration versus the last two years. This projection doesn't excite us and suggests its products and services will face some demand challenges.
Here at StockStory, we certainly understand the potential of thematic investing. Diverse winners from Microsoft (MSFT) to Alphabet (GOOG), Coca-Cola (KO) to Monster Beverage (MNST) could all have been identified as promising growth stories with a megatrend driving the growth. So, in that spirit, we’ve identified a relatively under-the-radar profitable growth stock benefiting from the rise of AI, available to you FREE via this link.
Operating Margin
Taylor Morrison Home has been an efficient company over the last five years. It was one of the more profitable businesses in the industrials sector, boasting an average operating margin of 14.5%. This result was particularly impressive because of its low gross margin, which is mostly a factor of what it sells and takes huge shifts to move meaningfully. Companies have more control over their operating margins, and it’s a show of well-managed operations if they’re high when gross margins are low.
Looking at the trend in its profitability, Taylor Morrison Home’s operating margin rose by 4.1 percentage points over the last five years, as its sales growth gave it operating leverage. Its expansion was impressive, especially when considering most Home Builders peers saw their margins plummet.
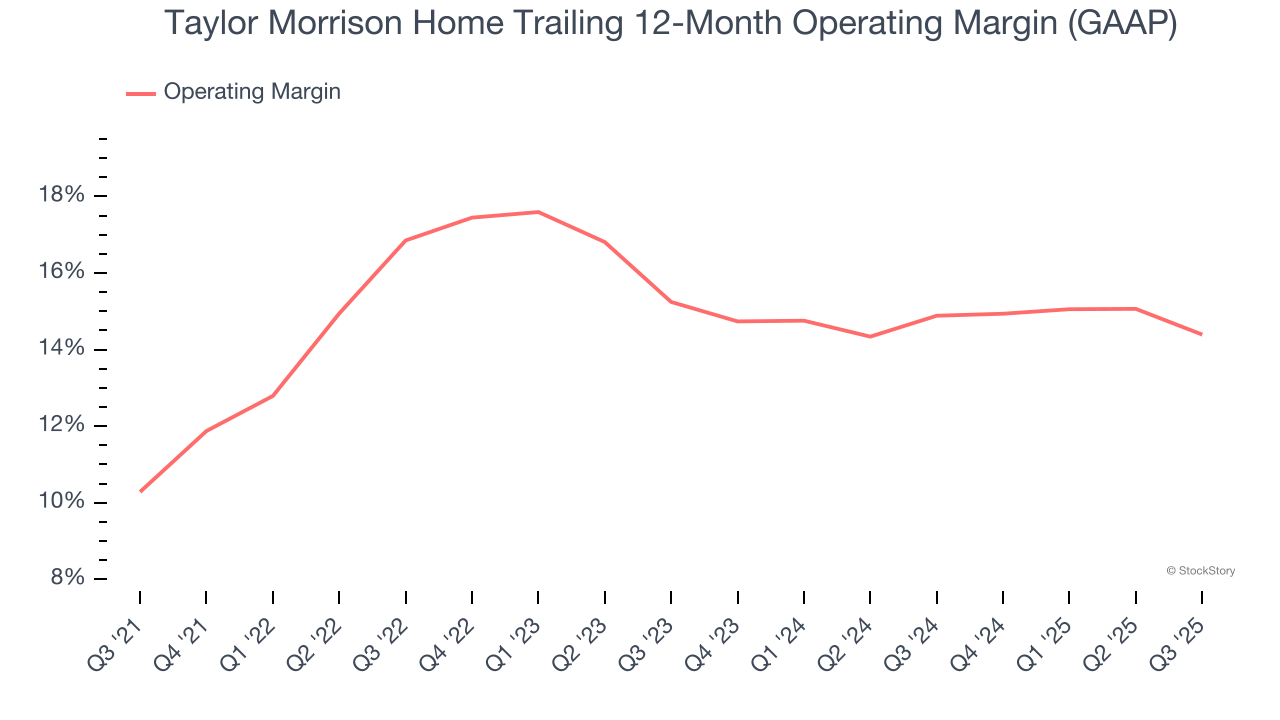
In Q3, Taylor Morrison Home generated an operating margin profit margin of 13%, down 2.7 percentage points year on year. Since Taylor Morrison Home’s operating margin decreased more than its gross margin, we can assume it was less efficient because expenses such as marketing, R&D, and administrative overhead increased.
Earnings Per Share
We track the long-term change in earnings per share (EPS) for the same reason as long-term revenue growth. Compared to revenue, however, EPS highlights whether a company’s growth is profitable.
Taylor Morrison Home’s EPS grew at an astounding 20.8% compounded annual growth rate over the last five years, higher than its 6.8% annualized revenue growth. This tells us the company became more profitable on a per-share basis as it expanded.
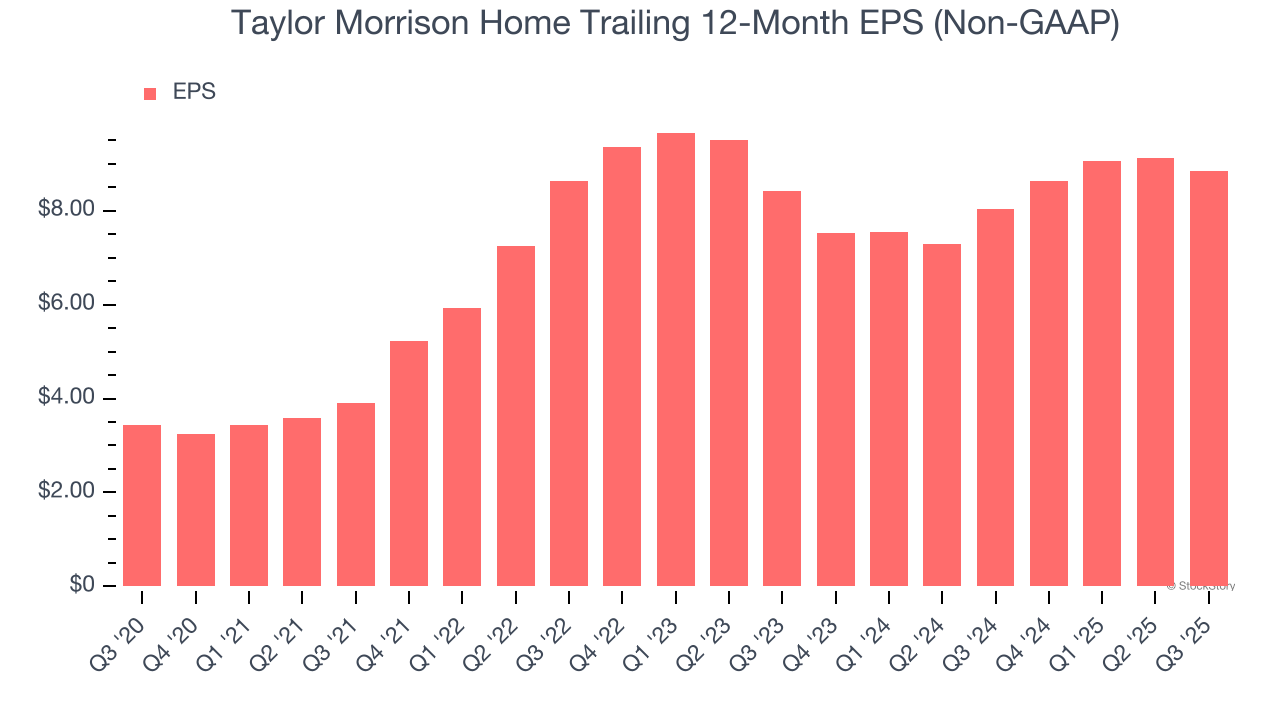
Diving into Taylor Morrison Home’s quality of earnings can give us a better understanding of its performance. As we mentioned earlier, Taylor Morrison Home’s operating margin declined this quarter but expanded by 4.1 percentage points over the last five years. Its share count also shrank by 23.9%, and these factors together are positive signs for shareholders because improving profitability and share buybacks turbocharge EPS growth relative to revenue growth. 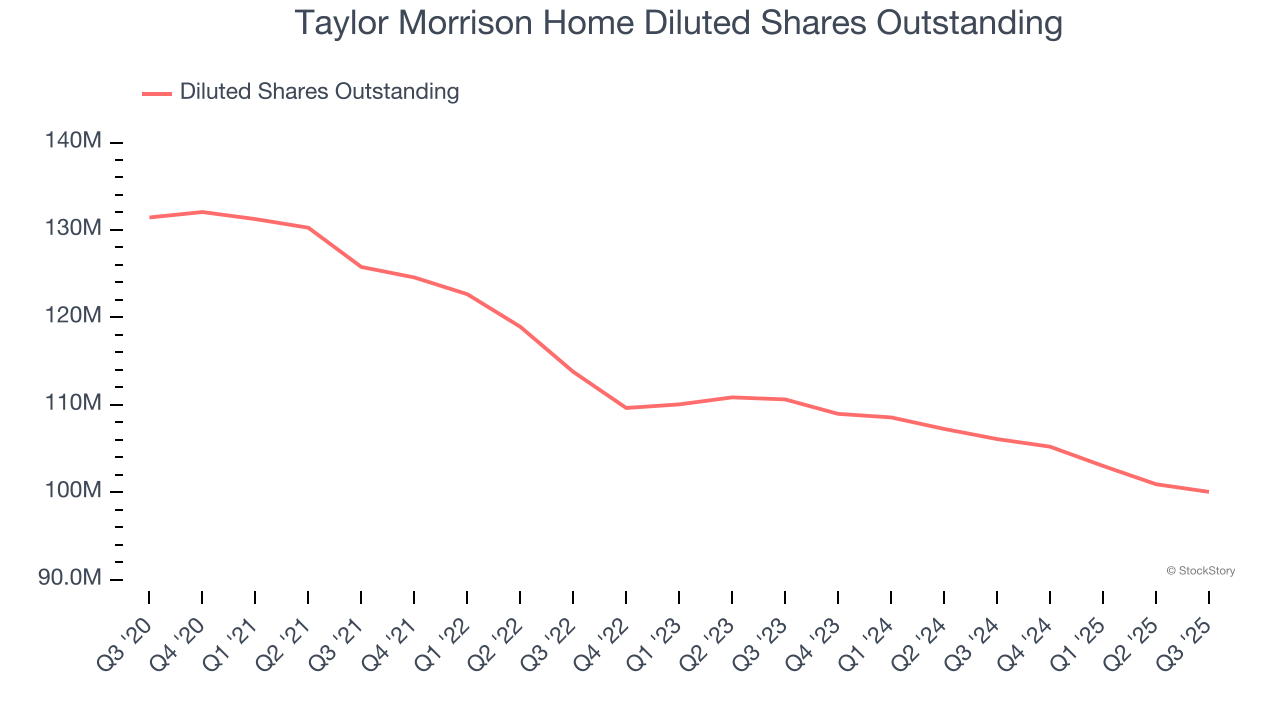
Like with revenue, we analyze EPS over a more recent period because it can provide insight into an emerging theme or development for the business.
For Taylor Morrison Home, its two-year annual EPS growth of 2.6% was lower than its five-year trend. We hope its growth can accelerate in the future.
In Q3, Taylor Morrison Home reported adjusted EPS of $2.11, down from $2.37 in the same quarter last year. Despite falling year on year, this print beat analysts’ estimates by 9.8%. Over the next 12 months, Wall Street expects Taylor Morrison Home’s full-year EPS of $8.85 to shrink by 20.8%.
Key Takeaways from Taylor Morrison Home’s Q3 Results
We were impressed by how significantly Taylor Morrison Home blew past analysts’ EBITDA expectations this quarter. We were also glad its revenue outperformed Wall Street’s estimates. On the other hand, its backlog missed. Overall, this print had some key positives. The stock traded up 5.5% to $66 immediately following the results.
Is Taylor Morrison Home an attractive investment opportunity at the current price? We think that the latest quarter is only one piece of the longer-term business quality puzzle. Quality, when combined with valuation, can help determine if the stock is a buy. We cover that in our actionable full research report which you can read here, it’s free for active Edge members.


