
What a time it’s been for Vishay Intertechnology. In the past six months alone, the company’s stock price has increased by a massive 54%, reaching $17.22 per share. This run-up might have investors contemplating their next move.
Is there a buying opportunity in Vishay Intertechnology, or does it present a risk to your portfolio? Get the full breakdown from our expert analysts, it’s free for active Edge members.
Why Do We Think Vishay Intertechnology Will Underperform?
We’re glad investors have benefited from the price increase, but we're cautious about Vishay Intertechnology. Here are three reasons you should be careful with VSH and a stock we'd rather own.
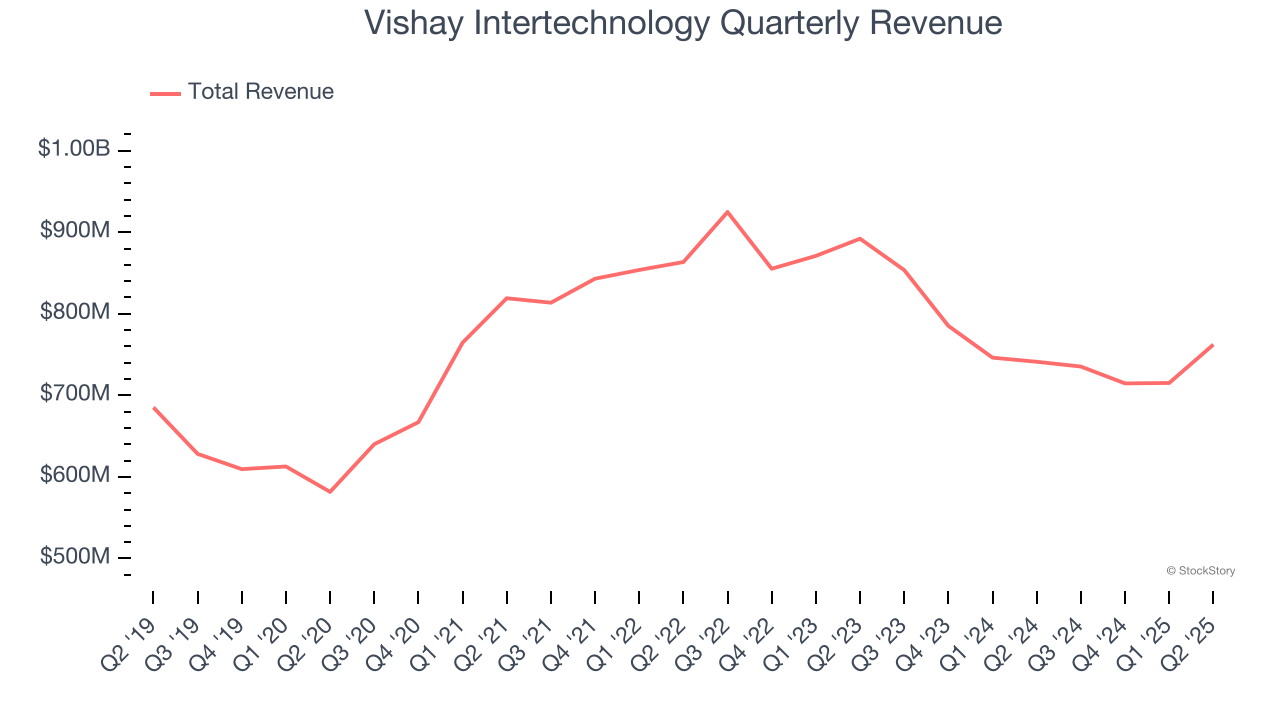
1. Long-Term Revenue Growth Disappoints
Reviewing a company’s long-term sales performance reveals insights into its quality. Even a bad business can shine for one or two quarters, but a top-tier one grows for years. Regrettably, Vishay Intertechnology’s sales grew at a mediocre 3.8% compounded annual growth rate over the last five years. This fell short of our benchmark for the semiconductor sector. Semiconductors are a cyclical industry, and long-term investors should be prepared for periods of high growth followed by periods of revenue contractions.
2. Low Gross Margin Reveals Weak Structural Profitability
Gross profit margin is a key metric to track because it shows how much money a semiconductor company gets to keep after paying for its raw materials, manufacturing, and other input costs.
Vishay Intertechnology’s gross margin is one of the worst in the semiconductor industry, signaling it operates in a competitive market and lacks pricing power. As you can see below, it averaged a 22.3% gross margin over the last two years. Said differently, Vishay Intertechnology had to pay a chunky $77.72 to its suppliers for every $100 in revenue. 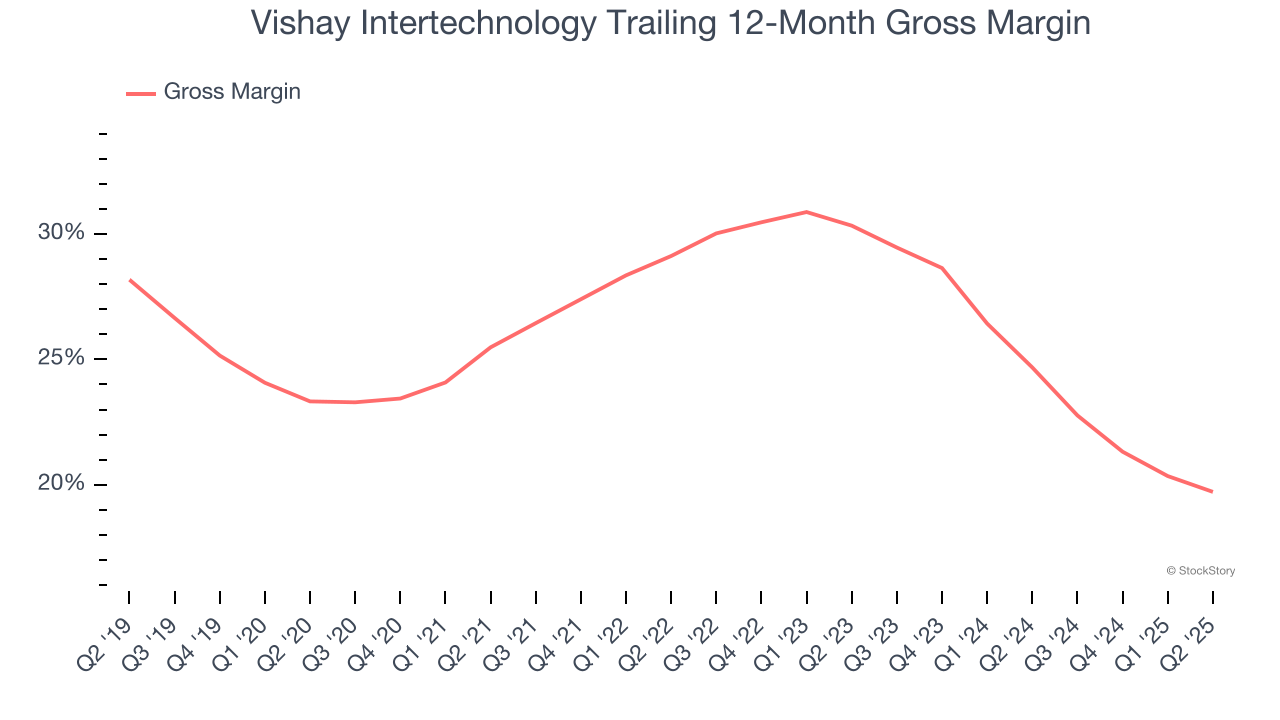
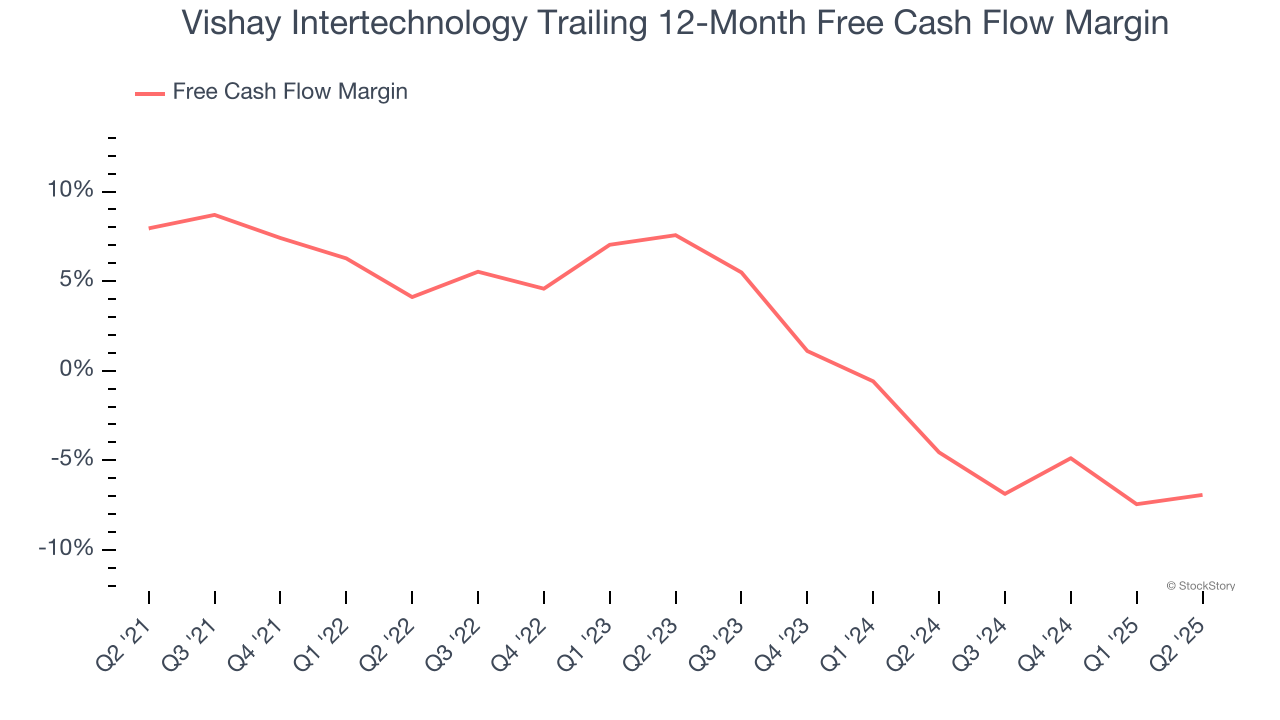
3. Free Cash Flow Margin Dropping
If you’ve followed StockStory for a while, you know we emphasize free cash flow. Why, you ask? We believe that in the end, cash is king, and you can’t use accounting profits to pay the bills.
As you can see below, Vishay Intertechnology’s margin dropped by 14.9 percentage points over the last five years. Almost any movement in the wrong direction is undesirable because it is already burning cash. If the trend continues, it could signal it’s becoming a more capital-intensive business. Vishay Intertechnology’s free cash flow margin for the trailing 12 months was negative 6.9%.
Final Judgment
We see the value of companies furthering technological innovation, but in the case of Vishay Intertechnology, we’re out. Following the recent rally, the stock trades at 50.3× forward P/E (or $17.22 per share). At this valuation, there’s a lot of good news priced in - we think other companies feature superior fundamentals at the moment. Let us point you toward the most entrenched endpoint security platform on the market.
Stocks We Like More Than Vishay Intertechnology
Trump’s April 2025 tariff bombshell triggered a massive market selloff, but stocks have since staged an impressive recovery, leaving those who panic sold on the sidelines.
Take advantage of the rebound by checking out our Top 5 Strong Momentum Stocks for this week. This is a curated list of our High Quality stocks that have generated a market-beating return of 183% over the last five years (as of March 31st 2025).
Stocks that made our list in 2020 include now familiar names such as Nvidia (+1,545% between March 2020 and March 2025) as well as under-the-radar businesses like the once-small-cap company Exlservice (+354% five-year return). Find your next big winner with StockStory today.
StockStory is growing and hiring equity analyst and marketing roles. Are you a 0 to 1 builder passionate about the markets and AI? See the open roles here.


