
Regional banking company Eastern Bankshares (NASDAQ: EBC) missed Wall Street’s revenue expectations in Q3 CY2025, but sales rose 14.4% year on year to $241.5 million. Its non-GAAP profit of $0.37 per share was 6.9% below analysts’ consensus estimates.
Is now the time to buy Eastern Bank? Find out by accessing our full research report, it’s free for active Edge members.
Eastern Bank (EBC) Q3 CY2025 Highlights:
- Net Interest Income: $200.2 million vs analyst estimates of $208 million (17.9% year-on-year growth, 3.8% miss)
- Net Interest Margin: 3.5% vs analyst estimates of 3.6% (10.2 basis point miss)
- Revenue: $241.5 million vs analyst estimates of $246.3 million (14.4% year-on-year growth, 2% miss)
- Efficiency Ratio: 58.2% vs analyst estimates of 53.5% (473.7 basis point miss)
- Adjusted EPS: $0.37 vs analyst expectations of $0.40 (6.9% miss)
- Tangible Book Value per Share: $13.14 vs analyst estimates of $12.87 (1.1% year-on-year decline, 2.1% beat)
- Market Capitalization: $3.65 billion
Company Overview
Founded in 1818 as one of America's oldest mutual banks before converting to a public company in 2020, Eastern Bankshares (NASDAQ: EBC) operates as a bank holding company providing commercial and retail banking services primarily in Massachusetts, New Hampshire, and Rhode Island.
Sales Growth
In general, banks make money from two primary sources. The first is net interest income, which is interest earned on loans, mortgages, and investments in securities minus interest paid out on deposits. The second source is non-interest income, which can come from bank account, credit card, wealth management, investing banking, and trading fees. Luckily, Eastern Bank’s revenue grew at an impressive 10.4% compounded annual growth rate over the last five years. Its growth beat the average banking company and shows its offerings resonate with customers.
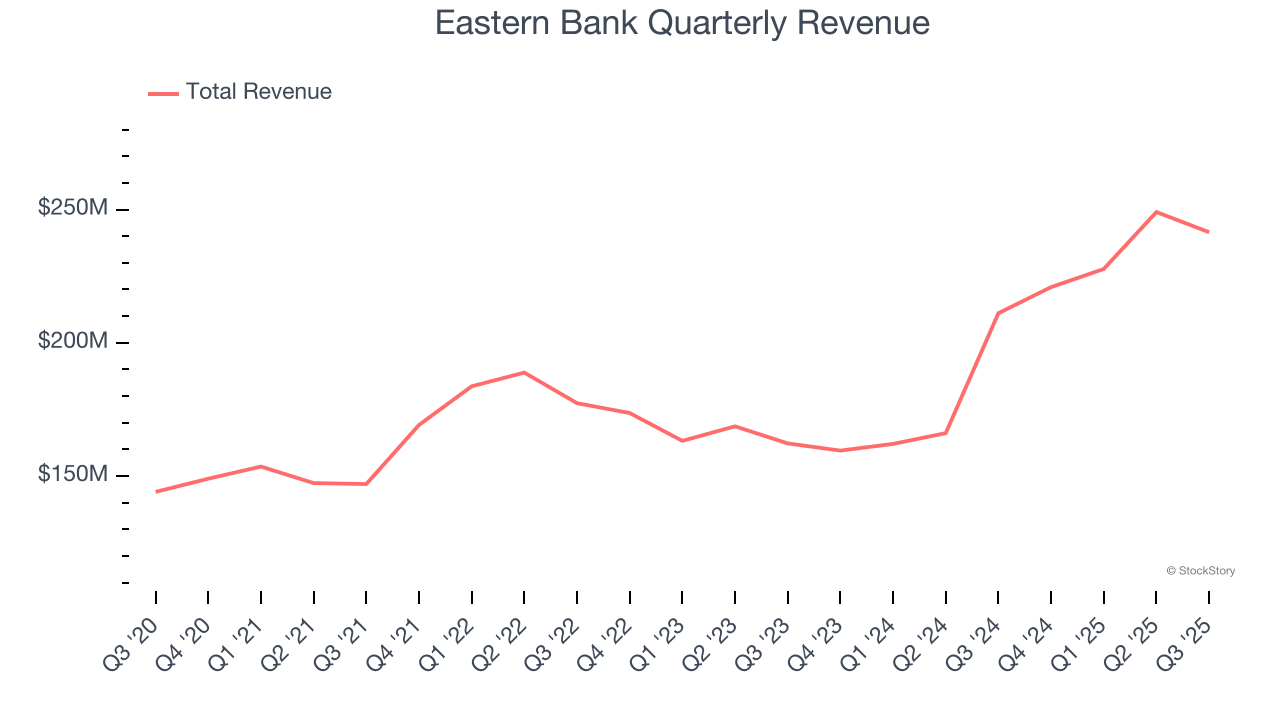
We at StockStory place the most emphasis on long-term growth, but within financials, a half-decade historical view may miss recent interest rate changes, market returns, and industry trends. Eastern Bank’s annualized revenue growth of 18.6% over the last two years is above its five-year trend, suggesting its demand was strong and recently accelerated. 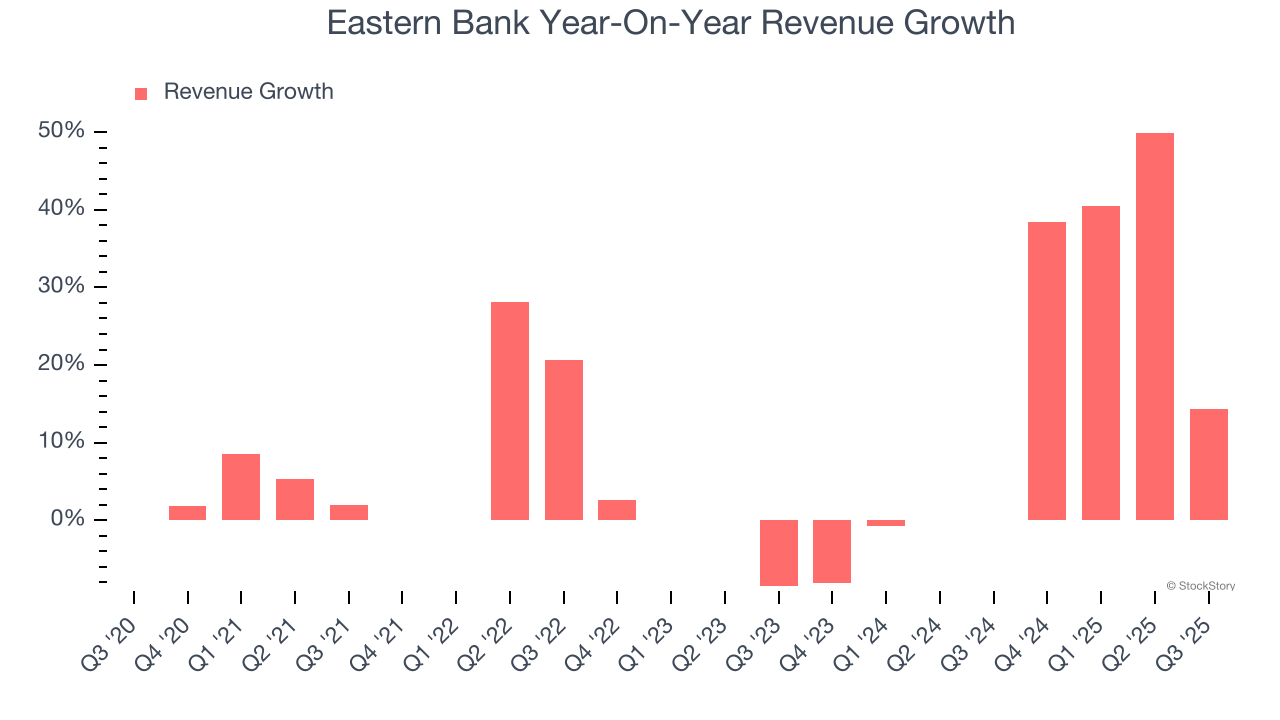 Note: Quarters not shown were determined to be outliers, impacted by outsized investment gains/losses that are not indicative of the recurring fundamentals of the business.
This quarter, Eastern Bank’s revenue grew by 14.4% year on year to $241.5 million but fell short of Wall Street’s estimates.
Net interest income made up 78.6% of the company’s total revenue during the last five years, meaning lending operations are Eastern Bank’s largest source of revenue.
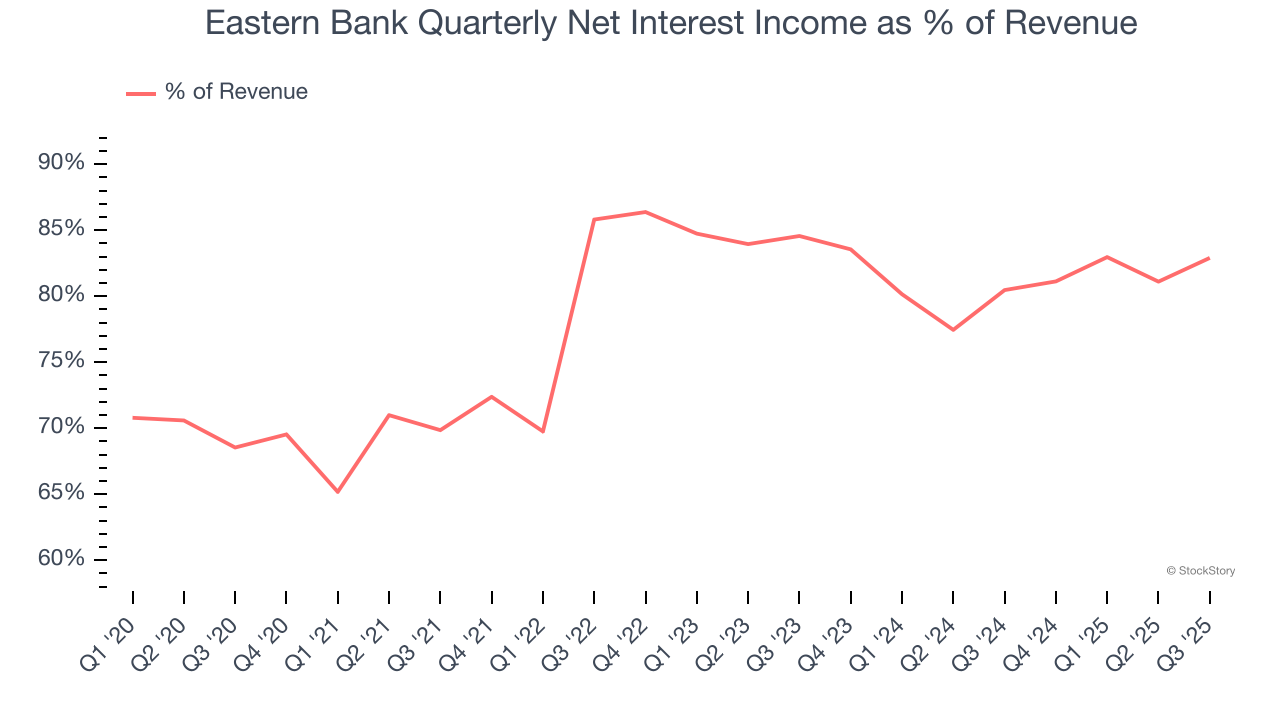
Markets consistently prioritize net interest income growth over fee-based revenue, recognizing its superior quality and recurring nature compared to the more unpredictable non-interest income streams.
Software is eating the world and there is virtually no industry left that has been untouched by it. That drives increasing demand for tools helping software developers do their jobs, whether it be monitoring critical cloud infrastructure, integrating audio and video functionality, or ensuring smooth content streaming. Click here to access a free report on our 3 favorite stocks to play this generational megatrend.
Tangible Book Value Per Share (TBVPS)
Banks operate as balance sheet businesses, with profits generated through borrowing and lending activities. Valuations reflect this reality, emphasizing balance sheet strength and long-term book value compounding ability.
This is why we consider tangible book value per share (TBVPS) the most important metric to track for banks. TBVPS represents the real, liquid net worth per share of a bank, excluding intangible assets that have debatable value upon liquidation. Other (and more commonly known) per-share metrics like EPS can sometimes be murky due to M&A or accounting rules allowing for loan losses to be spread out.
Eastern Bank’s TBVPS grew at an incredible 12.9% annual clip over the last five years. However, TBVPS growth has recently decelerated to 6.5% annual growth over the last two years (from $11.58 to $13.14 per share).
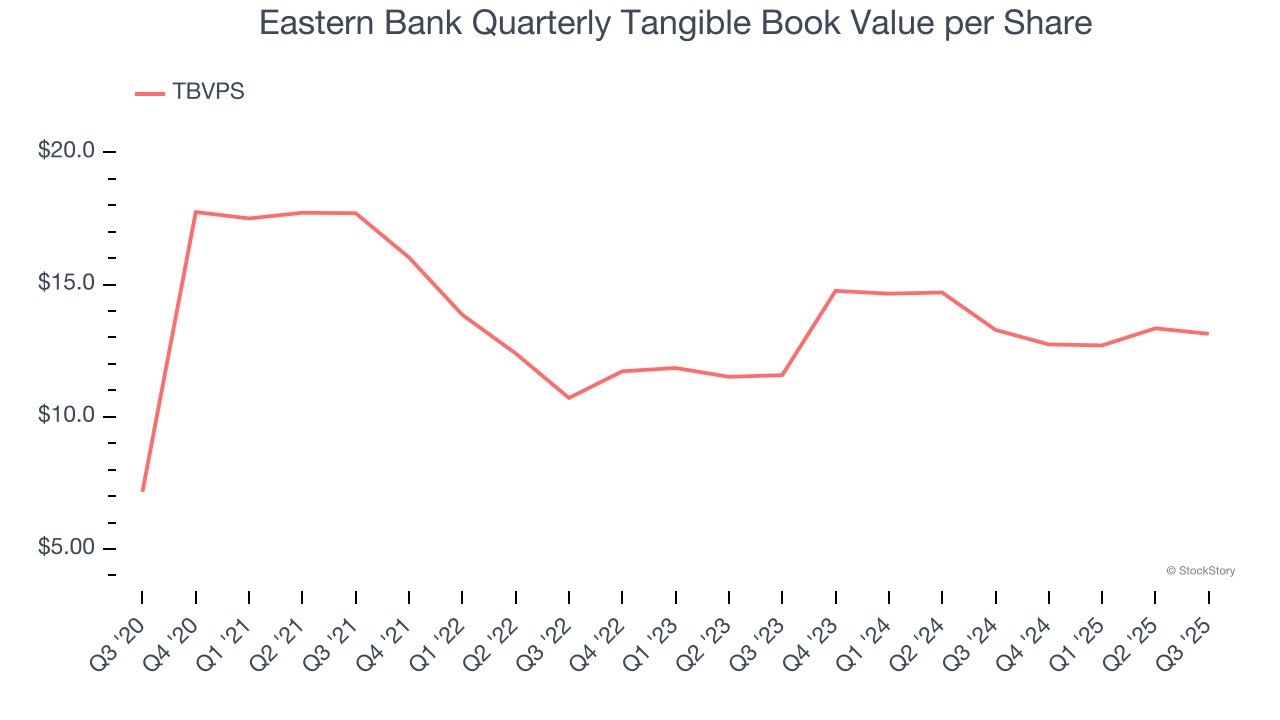
Over the next 12 months, Consensus estimates call for Eastern Bank’s TBVPS to remain flat at roughly $13.26, a disappointing projection.
Key Takeaways from Eastern Bank’s Q3 Results
It was encouraging to see Eastern Bank beat analysts’ tangible book value per share expectations this quarter. On the other hand, its net interest income missed and its EPS fell short of Wall Street’s estimates. Overall, this was a softer quarter. The stock traded down 4.2% to $17.60 immediately following the results.
Eastern Bank underperformed this quarter, but does that create an opportunity to invest right now? The latest quarter does matter, but not nearly as much as longer-term fundamentals and valuation, when deciding if the stock is a buy. We cover that in our actionable full research report which you can read here, it’s free for active Edge members.


