
Puerto Rican financial institution Popular (NASDAQ: BPOP) beat Wall Street’s revenue expectations in Q3 CY2025, with sales up 11% year on year to $817.7 million. Its GAAP profit of $3.14 per share was 6.4% above analysts’ consensus estimates.
Is now the time to buy Popular? Find out by accessing our full research report, it’s free for active Edge members.
Popular (BPOP) Q3 CY2025 Highlights:
- Net Interest Income: $646.5 million vs analyst estimates of $643.7 million (12.9% year-on-year growth, in line)
- Net Interest Margin: 3.5% vs analyst estimates of 3.5% (in line)
- Revenue: $817.7 million vs analyst estimates of $801.6 million (11% year-on-year growth, 2% beat)
- EPS (GAAP): $3.14 vs analyst estimates of $2.95 (6.4% beat)
- Tangible Book Value per Share: $79.12 vs analyst estimates of $78.04 (17.4% year-on-year growth, 1.4% beat)
- Market Capitalization: $7.80 billion
Company Overview
Founded in 1893 as the first bank in Puerto Rico to serve the working class, Popular (NASDAQ: BPOP) is a financial holding company that provides retail, mortgage, and commercial banking services primarily in Puerto Rico and the mainland United States.
Sales Growth
Two primary revenue streams drive bank earnings. While net interest income, which is earned by charging higher rates on loans than paid on deposits, forms the foundation, fee-based services across banking, credit, wealth management, and trading operations provide additional income. Over the last five years, Popular grew its revenue at a decent 5.8% compounded annual growth rate. Its growth was slightly above the average banking company and shows its offerings resonate with customers.
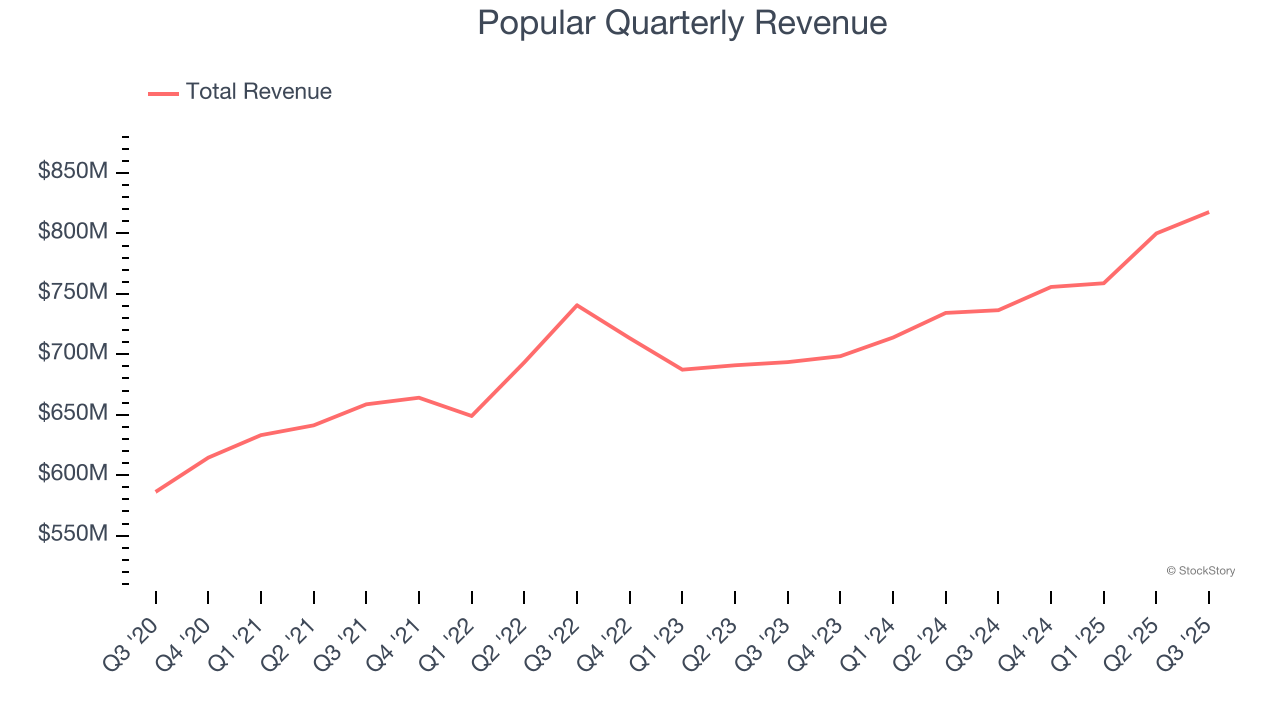
Long-term growth is the most important, but within financials, a half-decade historical view may miss recent interest rate changes and market returns. Popular’s annualized revenue growth of 6% over the last two years aligns with its five-year trend, suggesting its demand was stable. 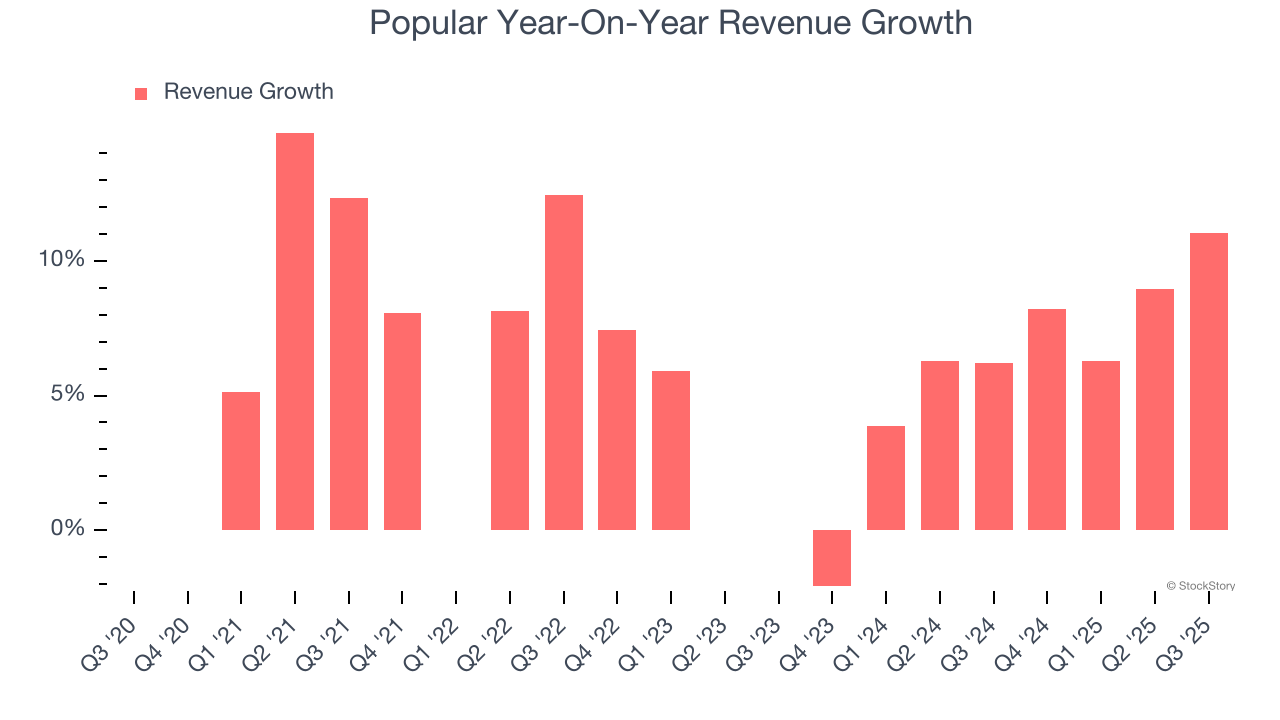 Note: Quarters not shown were determined to be outliers, impacted by outsized investment gains/losses that are not indicative of the recurring fundamentals of the business.
This quarter, Popular reported year-on-year revenue growth of 11%, and its $817.7 million of revenue exceeded Wall Street’s estimates by 2%.
Net interest income made up 77.2% of the company’s total revenue during the last five years, meaning lending operations are Popular’s largest source of revenue.
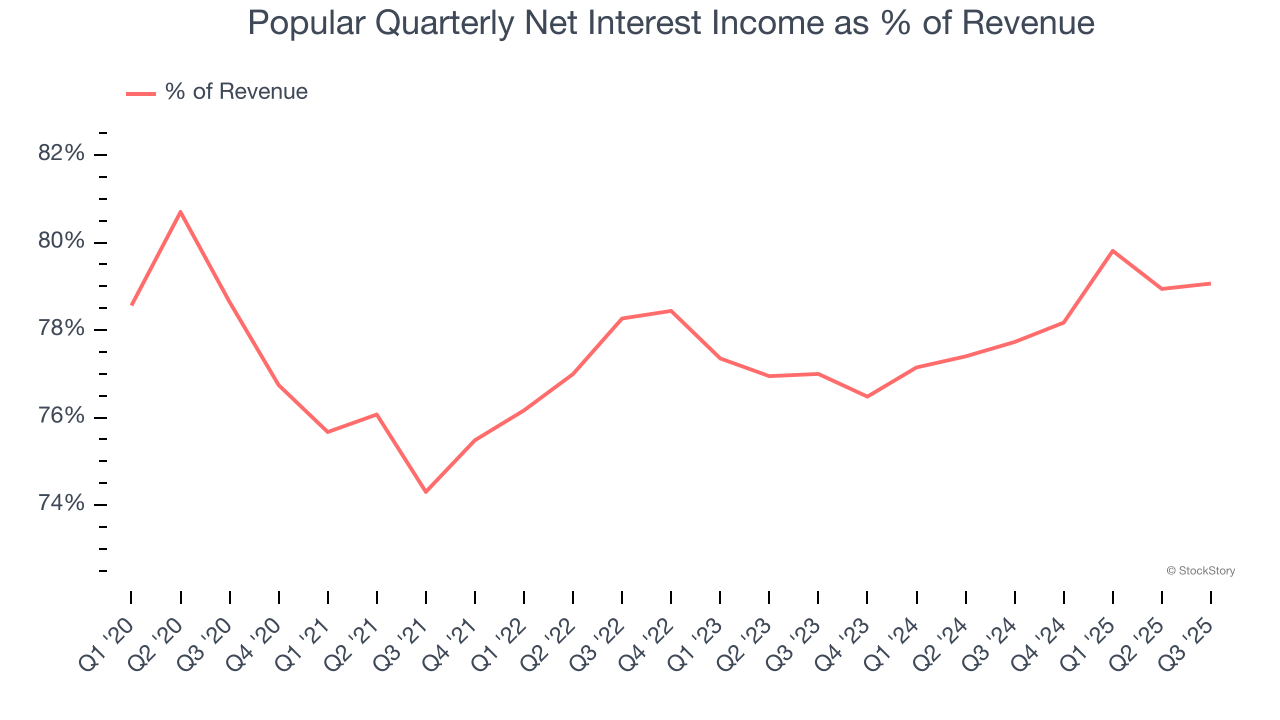
While banks generate revenue from multiple sources, investors view net interest income as the cornerstone - its predictable, recurring characteristics stand in sharp contrast to the volatility of non-interest income.
Software is eating the world and there is virtually no industry left that has been untouched by it. That drives increasing demand for tools helping software developers do their jobs, whether it be monitoring critical cloud infrastructure, integrating audio and video functionality, or ensuring smooth content streaming. Click here to access a free report on our 3 favorite stocks to play this generational megatrend.
Tangible Book Value Per Share (TBVPS)
The balance sheet drives banking profitability since earnings flow from the spread between borrowing and lending rates. As such, valuations for these companies concentrate on capital strength and sustainable equity accumulation potential.
When analyzing banks, tangible book value per share (TBVPS) takes precedence over many other metrics. This measure isolates genuine per-share value by removing intangible assets of debatable liquidation worth. Traditional metrics like EPS are helpful but face distortion from M&A activity and loan loss accounting rules.
Popular’s TBVPS grew at a decent 5.1% annual clip over the last five years. TBVPS growth has accelerated recently, growing by 26.9% annually over the last two years from $49.09 to $79.12 per share.
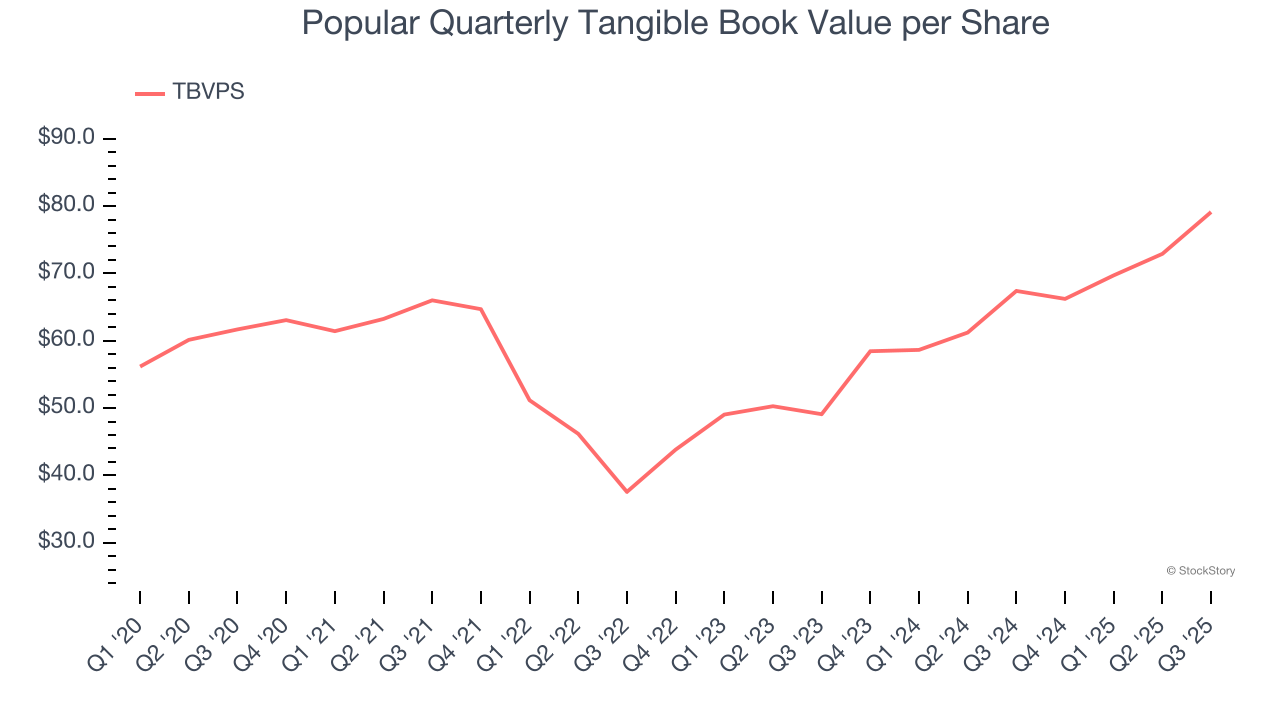
Over the next 12 months, Consensus estimates call for Popular’s TBVPS to grow by 14.3% to $90.40, top-notch growth rate.
Key Takeaways from Popular’s Q3 Results
It was encouraging to see Popular beat analysts’ revenue expectations this quarter. We were also happy its tangible book value per share narrowly outperformed Wall Street’s estimates. Overall, this print had some key positives. The stock traded up 4% to $119.99 immediately after reporting.
Popular had an encouraging quarter, but one earnings result doesn’t necessarily make the stock a buy. Let’s see if this is a good investment. We think that the latest quarter is only one piece of the longer-term business quality puzzle. Quality, when combined with valuation, can help determine if the stock is a buy. We cover that in our actionable full research report which you can read here, it’s free for active Edge members.


