Although Worthington (currently trading at $57.72 per share) has gained 16.7% over the last six months, it has trailed the S&P 500’s 22.9% return during that period. This may have investors wondering how to approach the situation.
Is there a buying opportunity in Worthington, or does it present a risk to your portfolio? Get the full breakdown from our expert analysts, it’s free for active Edge members.
Why Do We Think Worthington Will Underperform?
We don't have much confidence in Worthington. Here are three reasons you should be careful with WOR and a stock we'd rather own.
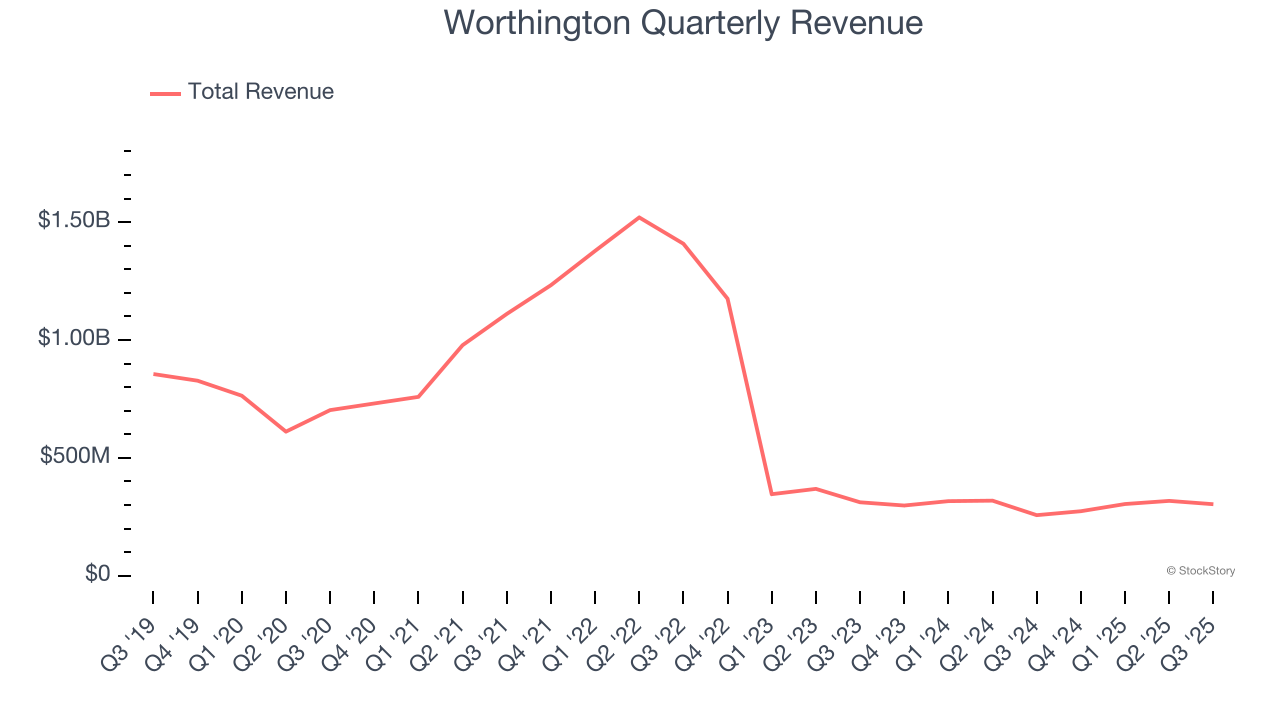
1. Revenue Spiraling Downwards
Examining a company’s long-term performance can provide clues about its quality. Any business can experience short-term success, but top-performing ones enjoy sustained growth for years. Over the last five years, Worthington’s demand was weak and its revenue declined by 16.2% per year. This wasn’t a great result and signals it’s a low quality business.
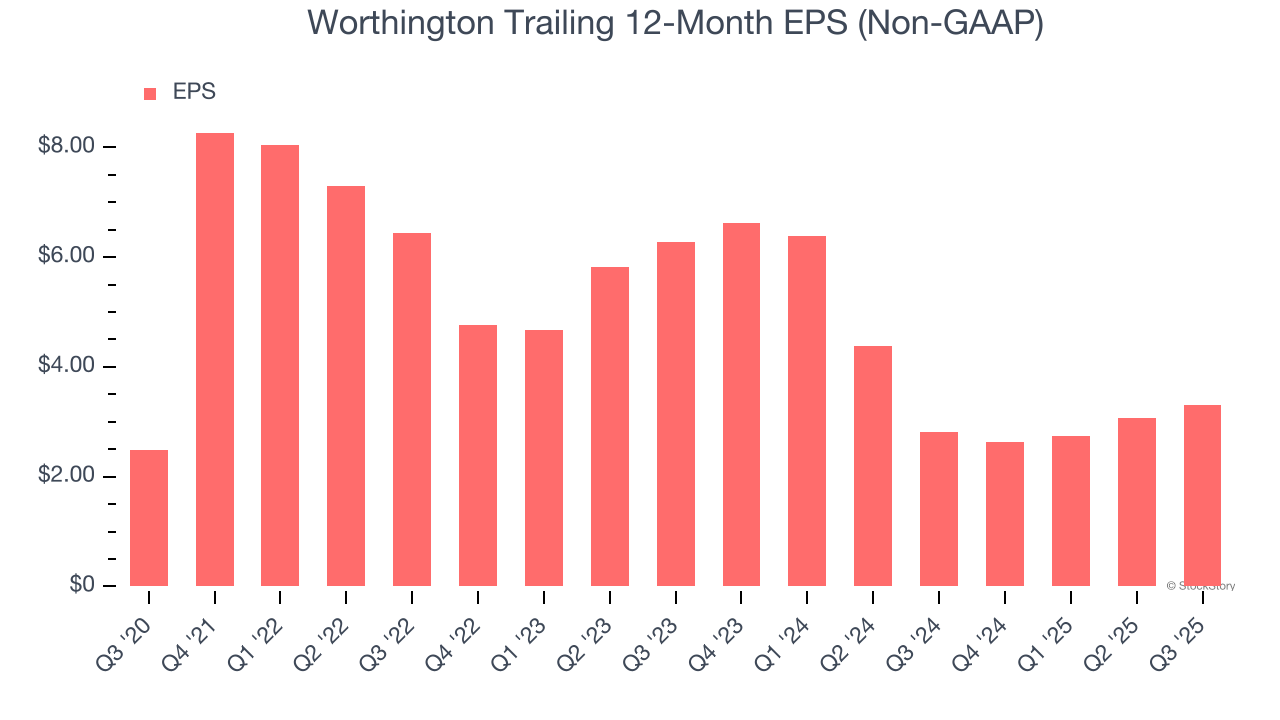
2. EPS Barely Growing
Analyzing the long-term change in earnings per share (EPS) shows whether a company's incremental sales were profitable – for example, revenue could be inflated through excessive spending on advertising and promotions.
Worthington’s EPS grew at an unimpressive 5.9% compounded annual growth rate over the last five years. On the bright side, this performance was better than its 16.2% annualized revenue declines and tells us management adapted its cost structure in response to a challenging demand environment.
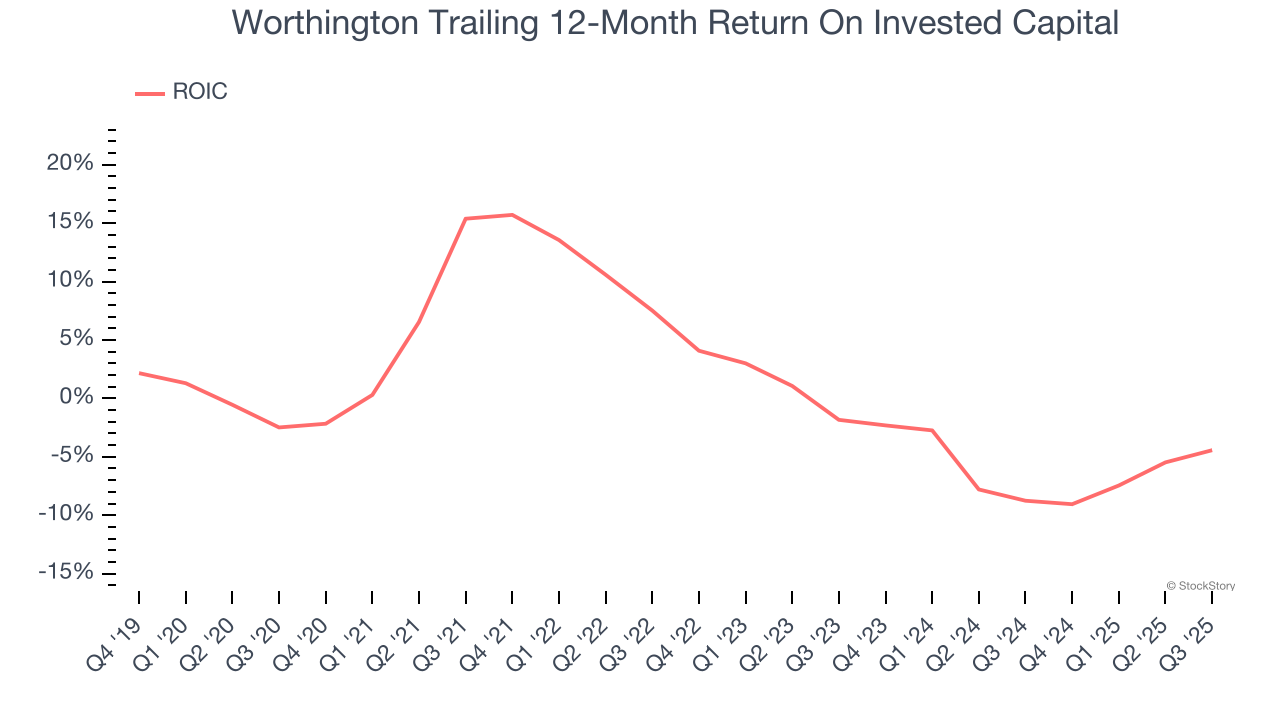
3. New Investments Fail to Bear Fruit as ROIC Declines
ROIC, or return on invested capital, is a metric showing how much operating profit a company generates relative to the money it has raised (debt and equity).
We like to invest in businesses with high returns, but the trend in a company’s ROIC is what often surprises the market and moves the stock price. Over the last few years, Worthington’s ROIC has unfortunately decreased significantly. Paired with its already low returns, these declines suggest its profitable growth opportunities are few and far between.
Final Judgment
We see the value of companies helping their customers, but in the case of Worthington, we’re out. With its shares lagging the market recently, the stock trades at 15.6× forward P/E (or $57.72 per share). This valuation is reasonable, but the company’s shaky fundamentals present too much downside risk. There are more exciting stocks to buy at the moment. We’d recommend looking at the most dominant software business in the world.
Stocks We Like More Than Worthington
Trump’s April 2025 tariff bombshell triggered a massive market selloff, but stocks have since staged an impressive recovery, leaving those who panic sold on the sidelines.
Take advantage of the rebound by checking out our Top 5 Growth Stocks for this month. This is a curated list of our High Quality stocks that have generated a market-beating return of 183% over the last five years (as of March 31st 2025).
Stocks that made our list in 2020 include now familiar names such as Nvidia (+1,545% between March 2020 and March 2025) as well as under-the-radar businesses like the once-small-cap company Comfort Systems (+782% five-year return). Find your next big winner with StockStory today.
StockStory is growing and hiring equity analyst and marketing roles. Are you a 0 to 1 builder passionate about the markets and AI? See the open roles here.


