
Regional banking company Enterprise Financial Services (NASDAQ: EFSC) reported Q3 CY2025 results topping the market’s revenue expectations, with sales up 24.3% year on year to $204.9 million. Its non-GAAP profit of $1.20 per share was 7.3% below analysts’ consensus estimates.
Is now the time to buy Enterprise Financial Services? Find out by accessing our full research report, it’s free for active Edge members.
Enterprise Financial Services (EFSC) Q3 CY2025 Highlights:
- Net Interest Income: $158.3 million vs analyst estimates of $157 million (10.3% year-on-year growth, 0.8% beat)
- Net Interest Margin: 4.2% vs analyst estimates of 4.2% (5.2 basis point beat)
- Revenue: $204.9 million vs analyst estimates of $174.8 million (24.3% year-on-year growth, 17.3% beat)
- Efficiency Ratio: 61% vs analyst estimates of 60.2% (84.4 basis point miss)
- Adjusted EPS: $1.20 vs analyst expectations of $1.29 (7.3% miss)
- Tangible Book Value per Share: $41.58 vs analyst estimates of $41.09 (11.6% year-on-year growth, 1.2% beat)
- Market Capitalization: $2.05 billion
Company Overview
Starting as a single bank in Missouri in 1988 and expanding through strategic growth, Enterprise Financial Services (NASDAQ: EFSC) is a financial holding company that offers banking, lending, and wealth management services to businesses and individuals across seven states.
Sales Growth
In general, banks make money from two primary sources. The first is net interest income, which is interest earned on loans, mortgages, and investments in securities minus interest paid out on deposits. The second source is non-interest income, which can come from bank account, credit card, wealth management, investing banking, and trading fees. Over the last five years, Enterprise Financial Services grew its revenue at an incredible 18.5% compounded annual growth rate. Its growth beat the average banking company and shows its offerings resonate with customers, a helpful starting point for our analysis.
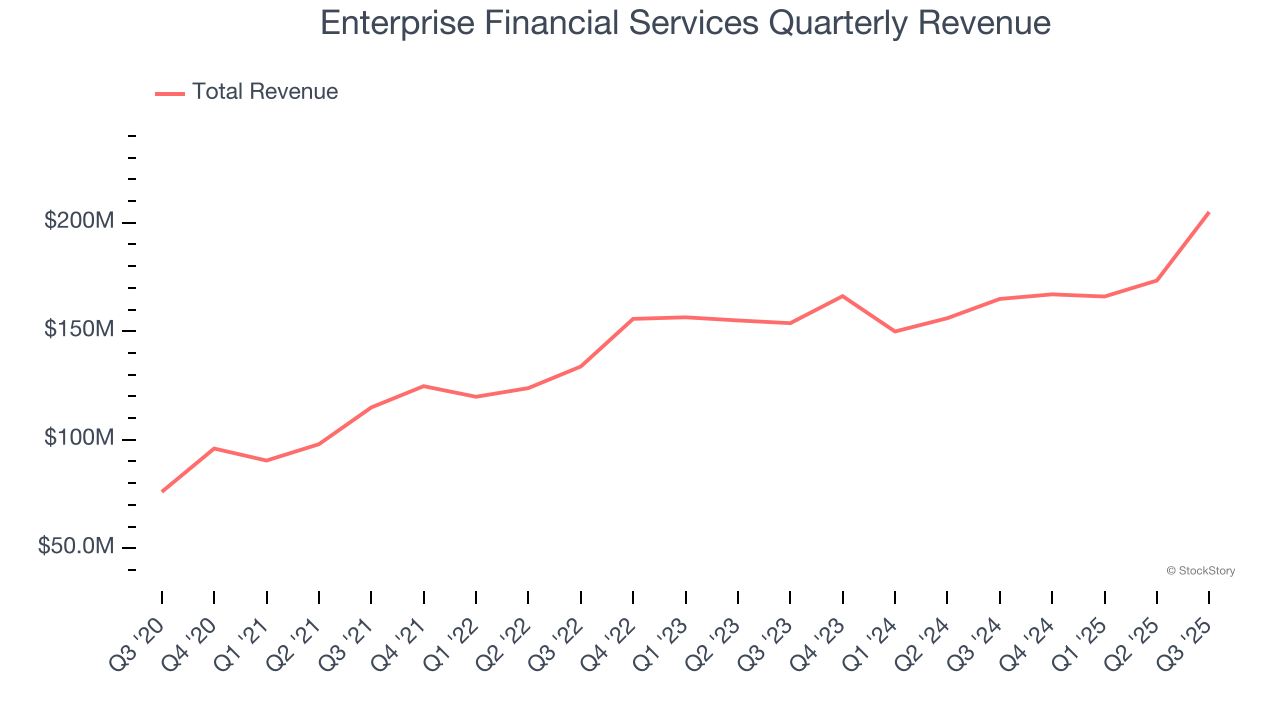
We at StockStory place the most emphasis on long-term growth, but within financials, a half-decade historical view may miss recent interest rate changes, market returns, and industry trends. Enterprise Financial Services’s annualized revenue growth of 7% over the last two years is below its five-year trend, but we still think the results suggest healthy demand. 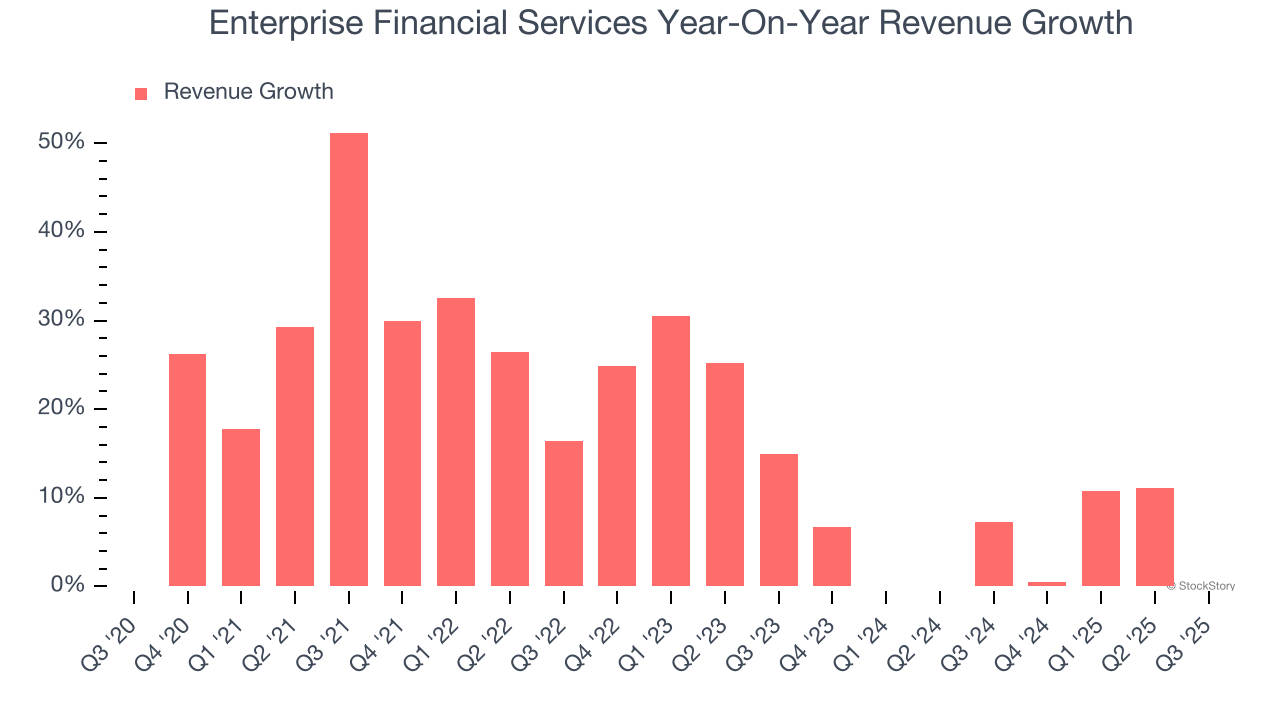 Note: Quarters not shown were determined to be outliers, impacted by outsized investment gains/losses that are not indicative of the recurring fundamentals of the business.
This quarter, Enterprise Financial Services reported robust year-on-year revenue growth of 24.3%, and its $204.9 million of revenue topped Wall Street estimates by 17.3%.
Net interest income made up 87% of the company’s total revenue during the last five years, meaning Enterprise Financial Services barely relies on non-interest income to drive its overall growth.
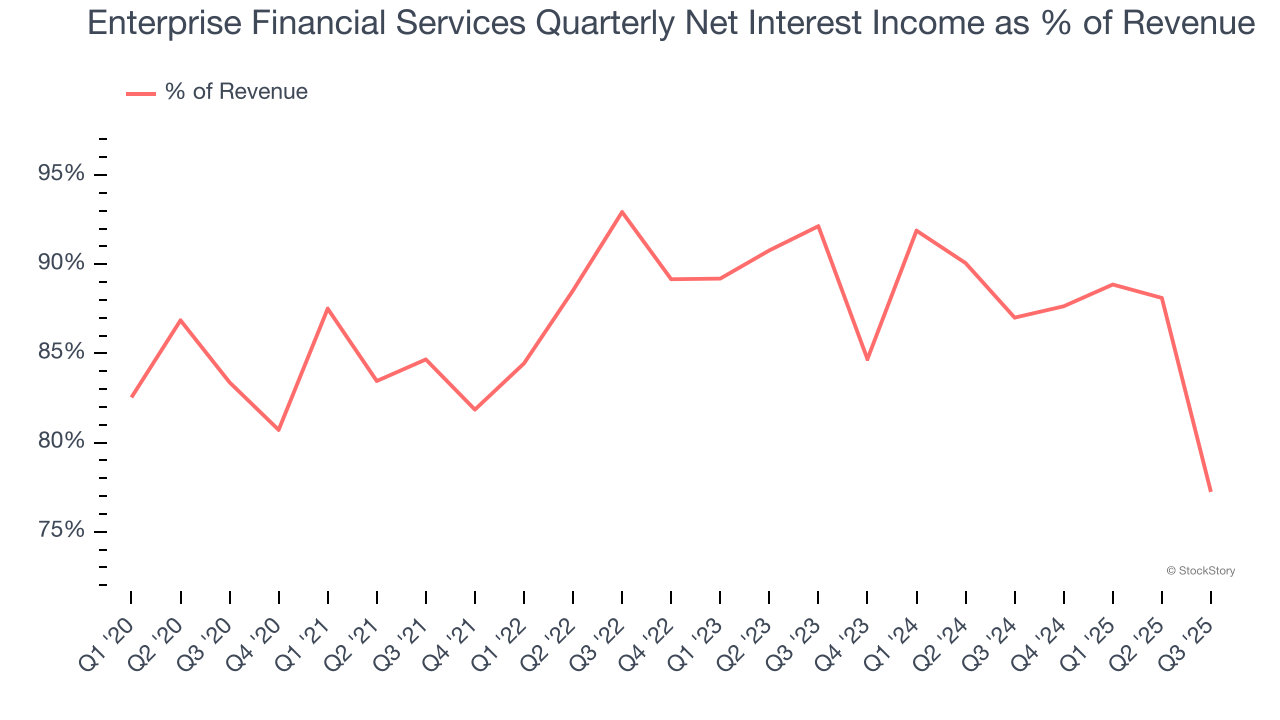
Our experience and research show the market cares primarily about a bank’s net interest income growth as non-interest income is considered a lower-quality and non-recurring revenue source.
Today’s young investors won’t have read the timeless lessons in Gorilla Game: Picking Winners In High Technology because it was written more than 20 years ago when Microsoft and Apple were first establishing their supremacy. But if we apply the same principles, then enterprise software stocks leveraging their own generative AI capabilities may well be the Gorillas of the future. So, in that spirit, we are excited to present our Special Free Report on a profitable, fast-growing enterprise software stock that is already riding the automation wave and looking to catch the generative AI next.
Tangible Book Value Per Share (TBVPS)
The balance sheet drives banking profitability since earnings flow from the spread between borrowing and lending rates. As such, valuations for these companies concentrate on capital strength and sustainable equity accumulation potential.
When analyzing banks, tangible book value per share (TBVPS) takes precedence over many other metrics. This measure isolates genuine per-share value by removing intangible assets of debatable liquidation worth. Other (and more commonly known) per-share metrics like EPS can sometimes be murky due to M&A or accounting rules allowing for loan losses to be spread out.
Enterprise Financial Services’s TBVPS grew at an incredible 10.9% annual clip over the last five years. TBVPS growth has also accelerated recently, growing by 15.7% annually over the last two years from $31.06 to $41.58 per share.
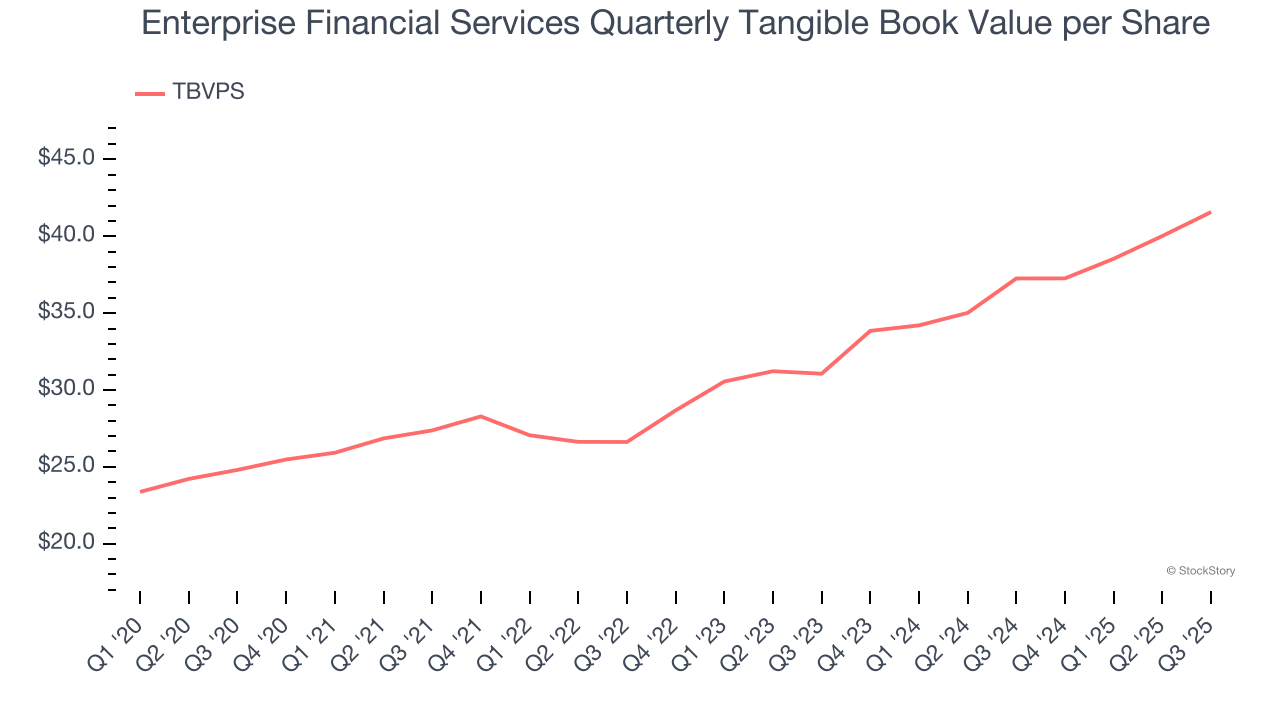
Over the next 12 months, Consensus estimates call for Enterprise Financial Services’s TBVPS to grow by 5.7% to $43.96, mediocre growth rate.
Key Takeaways from Enterprise Financial Services’s Q3 Results
We were impressed by how significantly Enterprise Financial Services blew past analysts’ revenue expectations this quarter. We were also happy its tangible book value per share narrowly outperformed Wall Street’s estimates. On the other hand, its EPS missed. Zooming out, we think this was a mixed quarter. The stock remained flat at $54.92 immediately after reporting.
Is Enterprise Financial Services an attractive investment opportunity right now? We think that the latest quarter is only one piece of the longer-term business quality puzzle. Quality, when combined with valuation, can help determine if the stock is a buy. We cover that in our actionable full research report which you can read here, it’s free for active Edge members.


