
Investment analytics provider MSCI (NYSE: MSCI) met Wall Street’s revenue expectations in Q3 CY2025, with sales up 9.5% year on year to $793.4 million. Its non-GAAP profit of $4.47 per share was 2.3% above analysts’ consensus estimates.
Is now the time to buy MSCI? Find out by accessing our full research report, it’s free for active Edge members.
MSCI (MSCI) Q3 CY2025 Highlights:
- Revenue: $793.4 million vs analyst estimates of $793.9 million (9.5% year-on-year growth, in line)
- Pre-tax Profit: $396.5 million (50% margin, 11.1% year-on-year growth)
- Adjusted EPS: $4.47 vs analyst estimates of $4.37 (2.3% beat)
- Market Capitalization: $42.31 billion
Company Overview
Originally known as Morgan Stanley Capital International before becoming independent in 2007, MSCI (NYSE: MSCI) provides critical decision support tools, indexes, and analytics that help global investors understand risk and return factors and build more effective investment portfolios.
Revenue Growth
A company’s long-term sales performance can indicate its overall quality. Any business can have short-term success, but a top-tier one grows for years. Luckily, MSCI’s revenue grew at a solid 13% compounded annual growth rate over the last five years. Its growth beat the average financials company and shows its offerings resonate with customers.
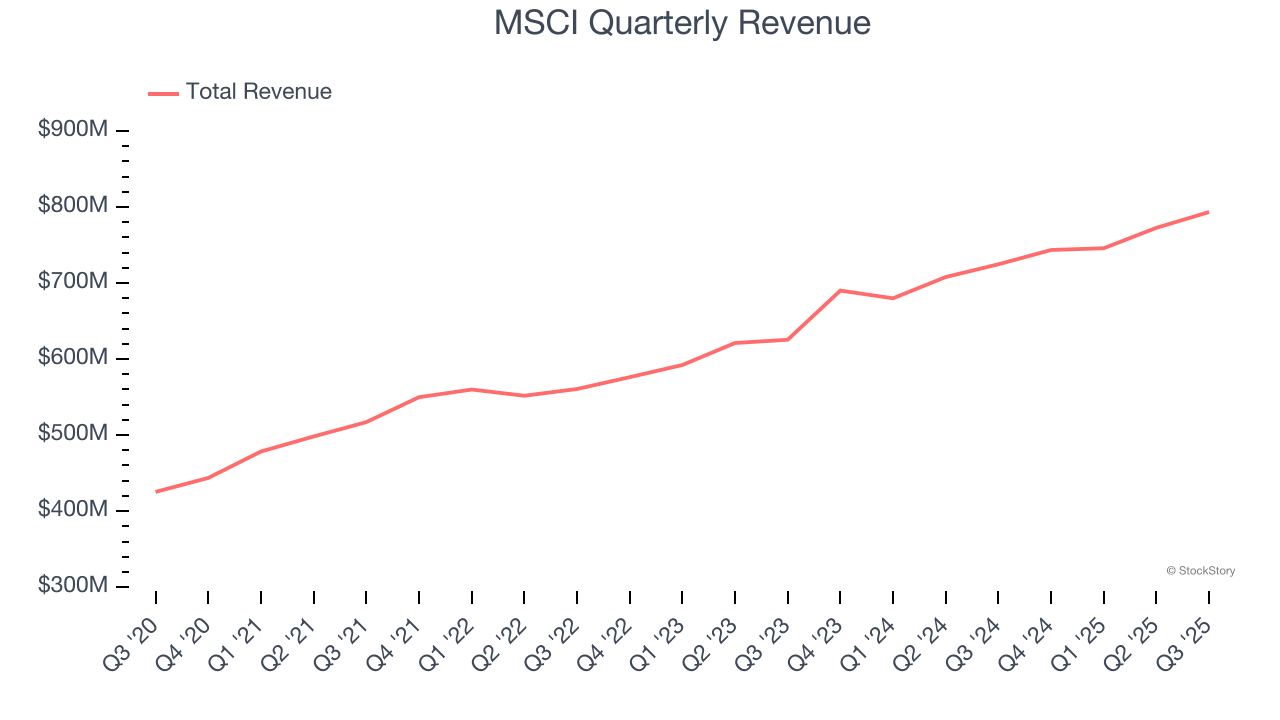
We at StockStory place the most emphasis on long-term growth, but within financials, a half-decade historical view may miss recent interest rate changes, market returns, and industry trends. MSCI’s annualized revenue growth of 12.5% over the last two years aligns with its five-year trend, suggesting its demand was predictably strong. 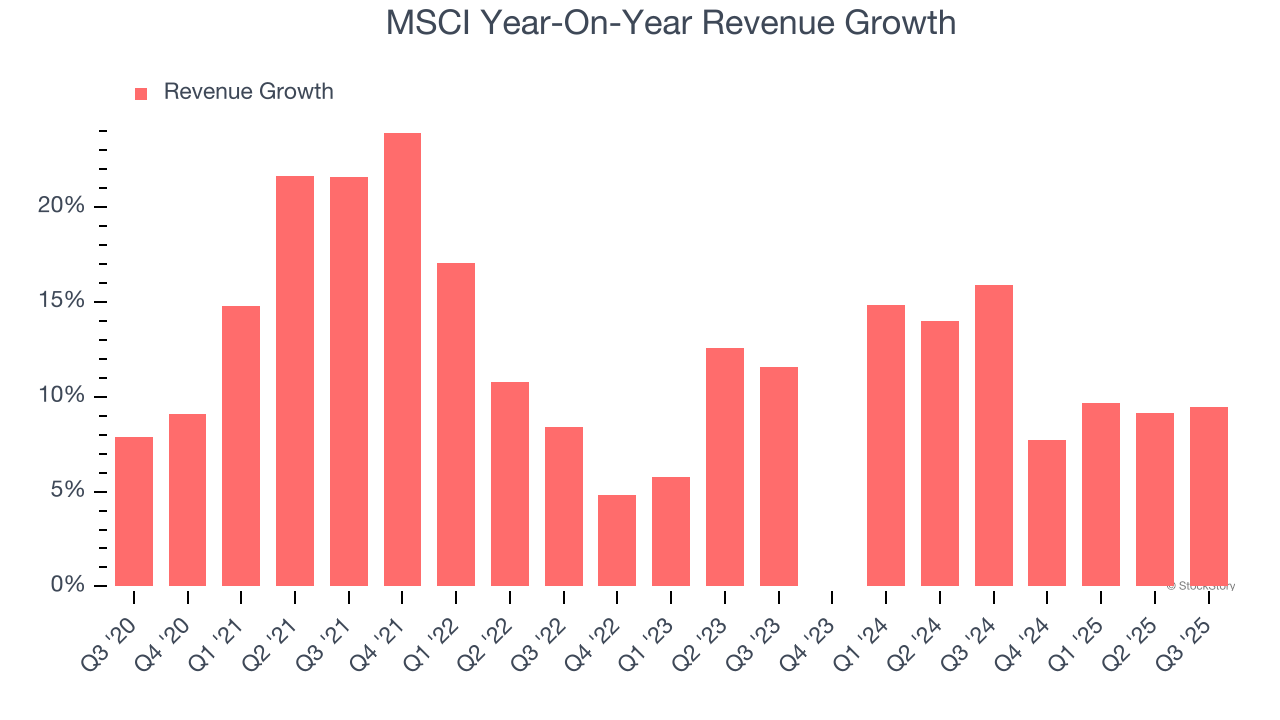 Note: Quarters not shown were determined to be outliers, impacted by outsized investment gains/losses that are not indicative of the recurring fundamentals of the business.
This quarter, MSCI grew its revenue by 9.5% year on year, and its $793.4 million of revenue was in line with Wall Street’s estimates.
Unless you’ve been living under a rock, it should be obvious by now that generative AI is going to have a huge impact on how large corporations do business. While Nvidia and AMD are trading close to all-time highs, we prefer a lesser-known (but still profitable) stock benefiting from the rise of AI. Click here to access our free report one of our favorites growth stories.
Key Takeaways from MSCI’s Q3 Results
It was good to see MSCI beat analysts’ EPS expectations this quarter despite in line revenue. The stock remained flat at $546.70 immediately after reporting.
So should you invest in MSCI right now? The latest quarter does matter, but not nearly as much as longer-term fundamentals and valuation, when deciding if the stock is a buy. We cover that in our actionable full research report which you can read here, it’s free for active Edge members.