
Restaurant company Cheesecake Factory (NASDAQ: CAKE) missed Wall Street’s revenue expectations in Q3 CY2025 as sales rose 4.8% year on year to $907.2 million. Its non-GAAP profit of $0.68 per share was 13.1% above analysts’ consensus estimates.
Is now the time to buy The Cheesecake Factory? Find out by accessing our full research report, it’s free for active Edge members.
The Cheesecake Factory (CAKE) Q3 CY2025 Highlights:
- Revenue: $907.2 million vs analyst estimates of $911.9 million (4.8% year-on-year growth, 0.5% miss)
- Adjusted EPS: $0.68 vs analyst estimates of $0.60 (13.1% beat)
- Adjusted EBITDA: $64.69 million vs analyst estimates of $64.72 million (7.1% margin, in line)
- Operating Margin: 4.1%, in line with the same quarter last year
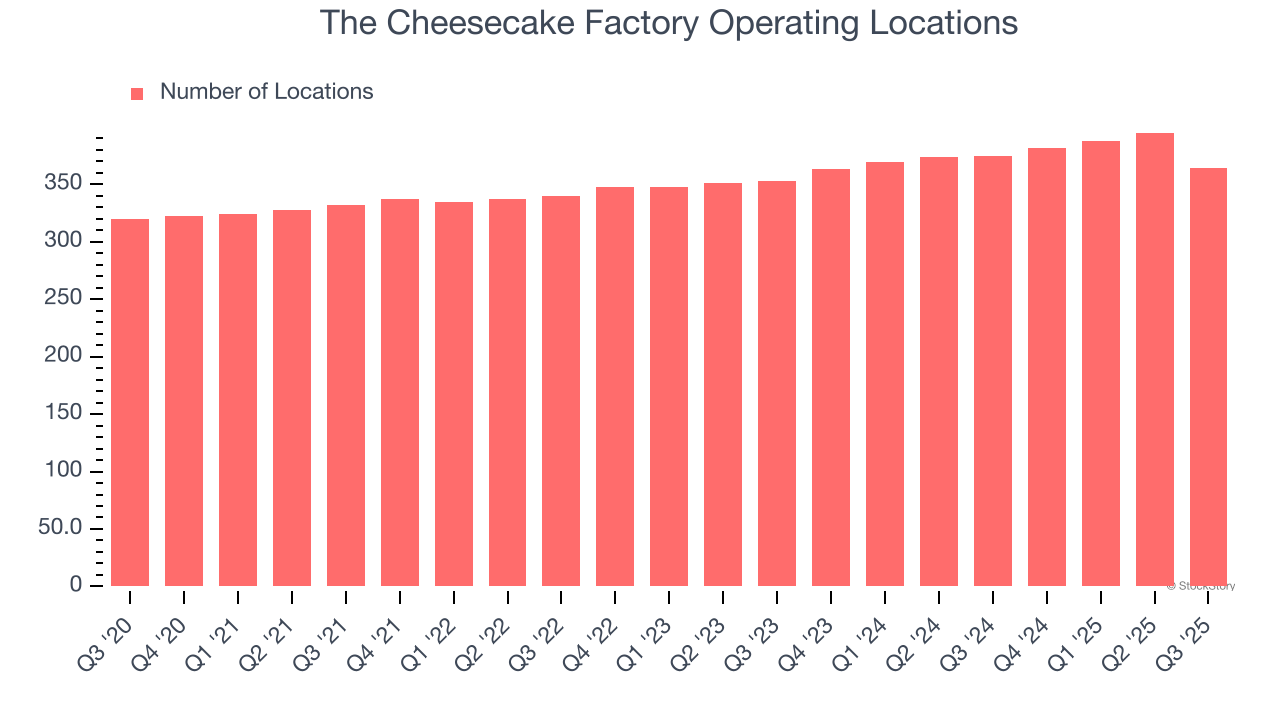
- Locations: 364 at quarter end, down from 375 in the same quarter last year
- Same-Store Sales were flat year on year (1.7% in the same quarter last year)
- Market Capitalization: $2.78 billion
“We delivered another quarter of solid results, with revenue within our guidance range and earnings and profitability finishing above the high end of our expectations,” said David Overton, Chairman and Chief Executive Officer.
Company Overview
Celebrated for its delicious (and free) brown bread, gigantic portions, and delectable desserts, Cheesecake Factory (NASDAQ: CAKE) is an iconic American restaurant chain that also owns and operates a portfolio of separate restaurant brands.
Revenue Growth
Reviewing a company’s long-term sales performance reveals insights into its quality. Any business can put up a good quarter or two, but many enduring ones grow for years.
With $3.71 billion in revenue over the past 12 months, The Cheesecake Factory is one of the larger restaurant chains in the industry and benefits from a well-known brand that influences consumer purchasing decisions.
As you can see below, The Cheesecake Factory’s 7.7% annualized revenue growth over the last six years (we compare to 2019 to normalize for COVID-19 impacts) was decent as it opened new restaurants and increased sales at existing, established dining locations.
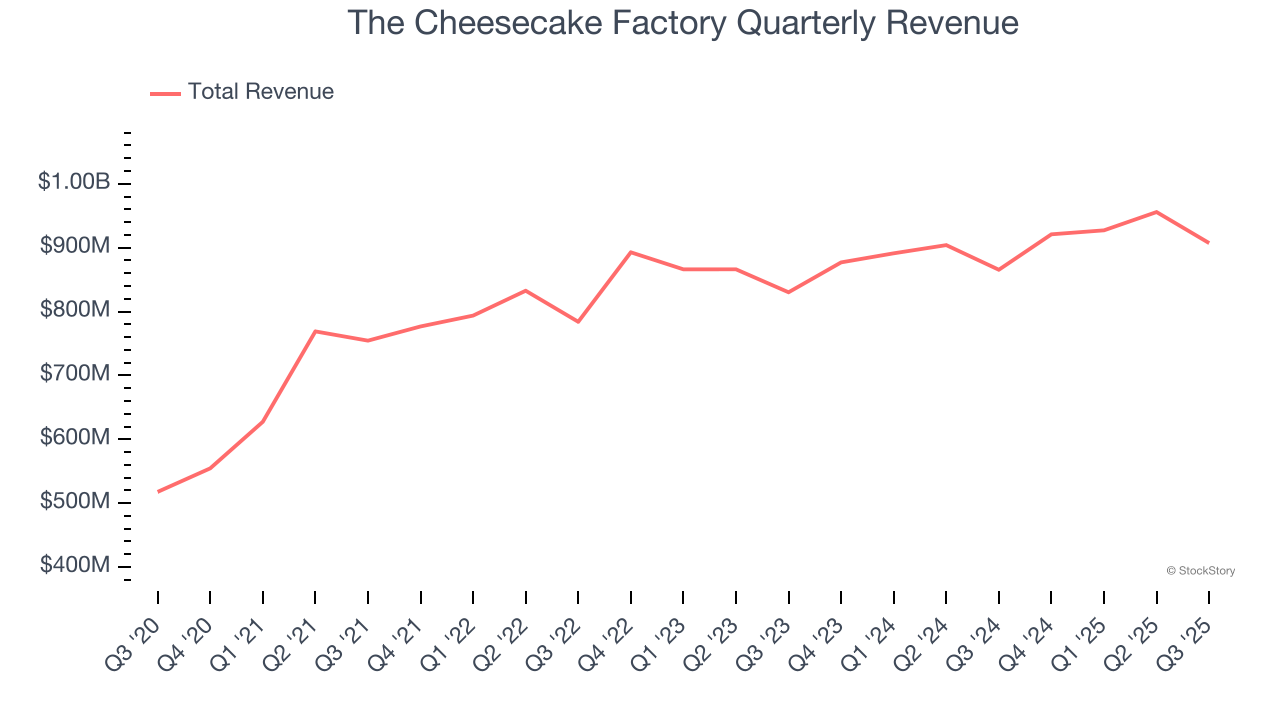
This quarter, The Cheesecake Factory’s revenue grew by 4.8% year on year to $907.2 million, falling short of Wall Street’s estimates.
Looking ahead, sell-side analysts expect revenue to grow 5.9% over the next 12 months, a slight deceleration versus the last six years. This projection doesn't excite us and implies its menu offerings will face some demand challenges.
Software is eating the world and there is virtually no industry left that has been untouched by it. That drives increasing demand for tools helping software developers do their jobs, whether it be monitoring critical cloud infrastructure, integrating audio and video functionality, or ensuring smooth content streaming. Click here to access a free report on our 3 favorite stocks to play this generational megatrend.
Restaurant Performance
Number of Restaurants
The Cheesecake Factory operated 364 locations in the latest quarter. It has opened new restaurants at a rapid clip over the last two years, averaging 4.5% annual growth, much faster than the broader restaurant sector.
When a chain opens new restaurants, it usually means it’s investing for growth because there’s healthy demand for its meals and there are markets where its concepts have few or no locations.
Same-Store Sales
A company's restaurant base only paints one part of the picture. When demand is high, it makes sense to open more. But when demand is low, it’s prudent to close some locations and use the money in other ways. Same-store sales is an industry measure of whether revenue is growing at those existing restaurants and is driven by customer visits (often called traffic) and the average spending per customer (ticket).
The Cheesecake Factory’s demand within its existing dining locations has been relatively stable over the last two years but was below most restaurant chains. On average, the company’s same-store sales have grown by 1.2% per year. This performance suggests it should consider improving its foot traffic and efficiency before expanding its restaurant base.
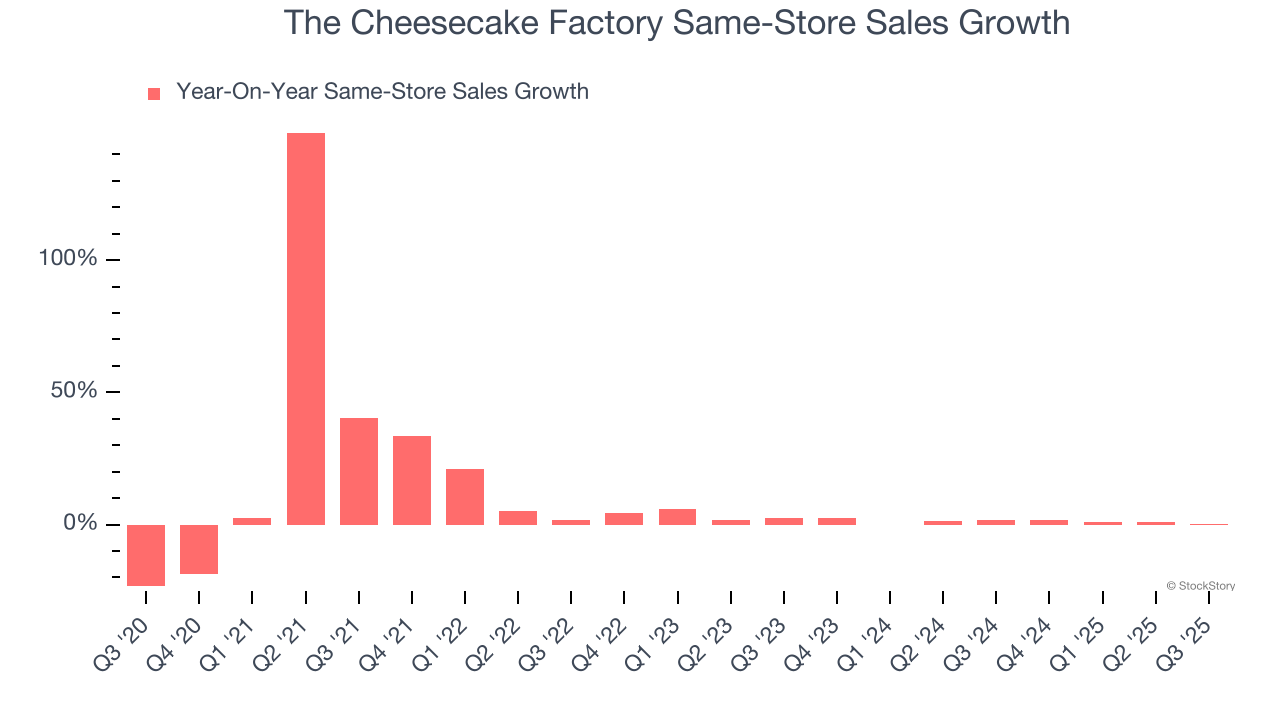
In the latest quarter, The Cheesecake Factory’s year on year same-store sales were flat. This was a meaningful deceleration from its historical levels. We’ll be watching closely to see if The Cheesecake Factory can reaccelerate growth.
Key Takeaways from The Cheesecake Factory’s Q3 Results
It was good to see The Cheesecake Factory beat analysts’ EPS expectations this quarter. On the other hand, its same-store sales and revenue fell slightly short of Wall Street’s estimates. Overall, this quarter could have been better. The stock traded down 1.1% to $53.83 immediately following the results.
So do we think The Cheesecake Factory is an attractive buy at the current price? When making that decision, it’s important to consider its valuation, business qualities, as well as what has happened in the latest quarter. We cover that in our actionable full research report which you can read here, it’s free for active Edge members.


