
RFID manufacturer Impinj (NASDAQ: PI) beat Wall Street’s revenue expectations in Q3 CY2025, but sales were flat year on year at $96.06 million. The company expects next quarter’s revenue to be around $91.5 million, close to analysts’ estimates. Its non-GAAP profit of $0.58 per share was 16.8% above analysts’ consensus estimates.
Is now the time to buy Impinj? Find out by accessing our full research report, it’s free for active Edge members.
Impinj (PI) Q3 CY2025 Highlights:
- Revenue: $96.06 million vs analyst estimates of $92.76 million (flat year on year, 3.6% beat)
- Adjusted EPS: $0.58 vs analyst estimates of $0.50 (16.8% beat)
- Adjusted EBITDA: $19.06 million vs analyst estimates of $15.69 million (19.8% margin, 21.5% beat)
- Revenue Guidance for Q4 CY2025 is $91.5 million at the midpoint, roughly in line with what analysts were expecting
- Adjusted EPS guidance for Q4 CY2025 is $0.50 at the midpoint, above analyst estimates of $0.45
- EBITDA guidance for Q4 CY2025 is $16.15 million at the midpoint, above analyst estimates of $13.97 million
- Operating Margin: 0.7%, up from -0.8% in the same quarter last year
- Free Cash Flow Margin: 18.7%, up from 4.9% in the same quarter last year
- Inventory Days Outstanding: 177, down from 212 in the previous quarter
- Market Capitalization: $6.86 billion
Company Overview
Founded by Caltech professor Carver Mead and one of his students Chris Diorio, Impinj (NASDAQ: PI) is a maker of radio-frequency identification (RFID) hardware and software.
Revenue Growth
A company’s long-term sales performance can indicate its overall quality. Any business can have short-term success, but a top-tier one grows for years. Over the last five years, Impinj grew its sales at an exceptional 20.2% compounded annual growth rate. Its growth beat the average semiconductor company and shows its offerings resonate with customers. Semiconductors are a cyclical industry, and long-term investors should be prepared for periods of high growth followed by periods of revenue contractions.
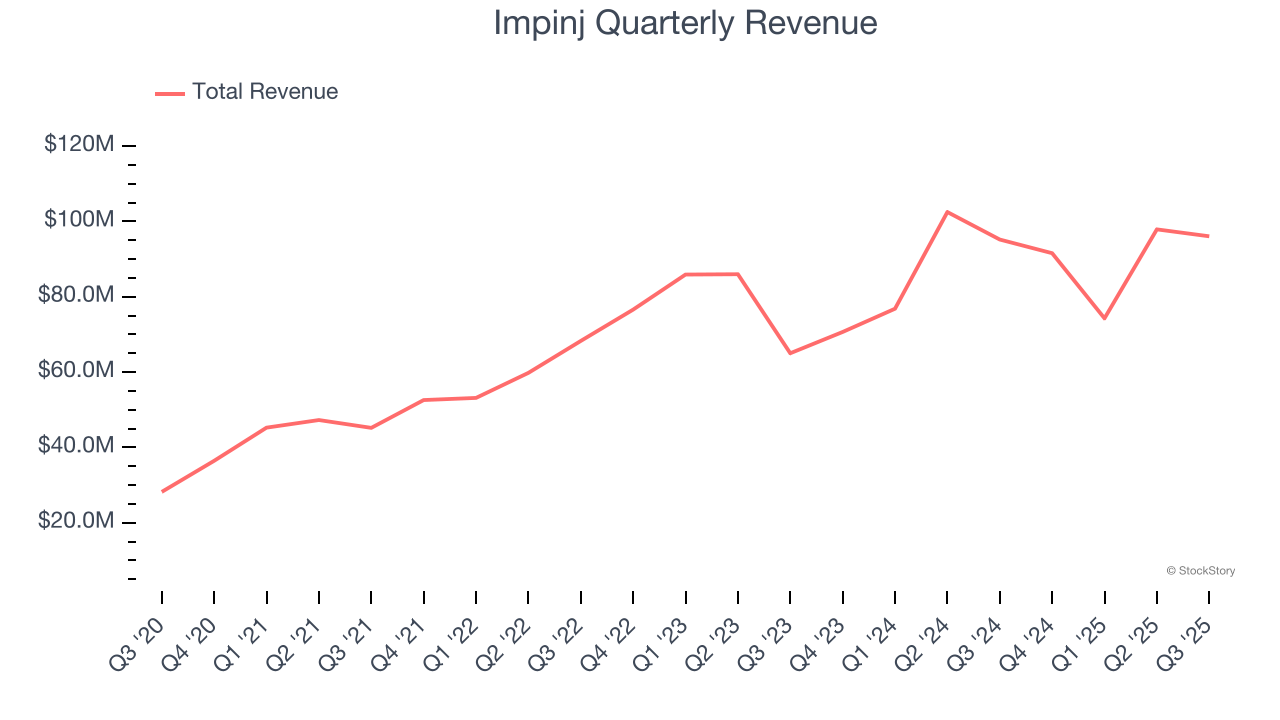
Long-term growth is the most important, but short-term results matter for semiconductors because the rapid pace of technological innovation (Moore's Law) could make yesterday's hit product obsolete today. Impinj’s annualized revenue growth of 7.1% over the last two years is below its five-year trend, but we still think the results suggest healthy demand. 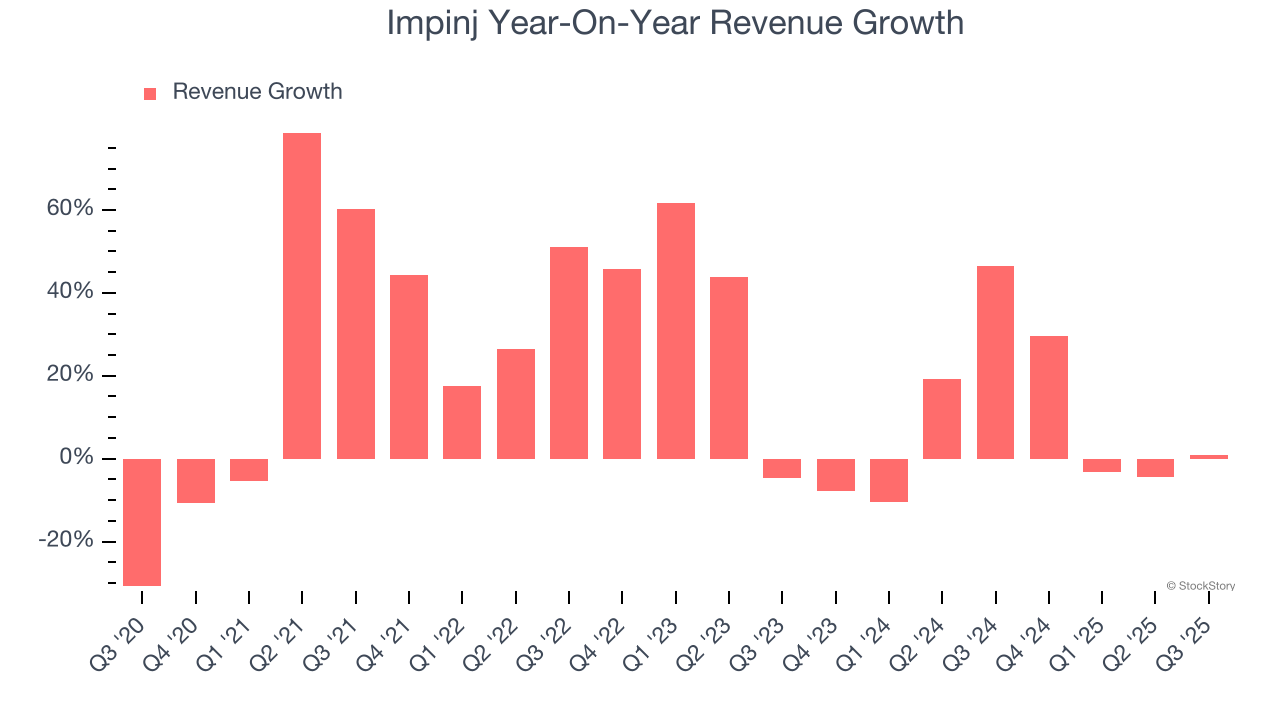
This quarter, Impinj’s $96.06 million of revenue was flat year on year but beat Wall Street’s estimates by 3.6%. Adding to the positive news, Impinj’s flat sales marked an inflection from its revenue decline last quarter, news that will likely give some shareholders hope. Company management is currently guiding for flat sales next quarter.
Looking further ahead, sell-side analysts expect revenue to grow 15.8% over the next 12 months, an improvement versus the last two years. This projection is healthy and suggests its newer products and services will spur better top-line performance.
Unless you’ve been living under a rock, it should be obvious by now that generative AI is going to have a huge impact on how large corporations do business. While Nvidia and AMD are trading close to all-time highs, we prefer a lesser-known (but still profitable) stock benefiting from the rise of AI. Click here to access our free report one of our favorites growth stories.
Product Demand & Outstanding Inventory
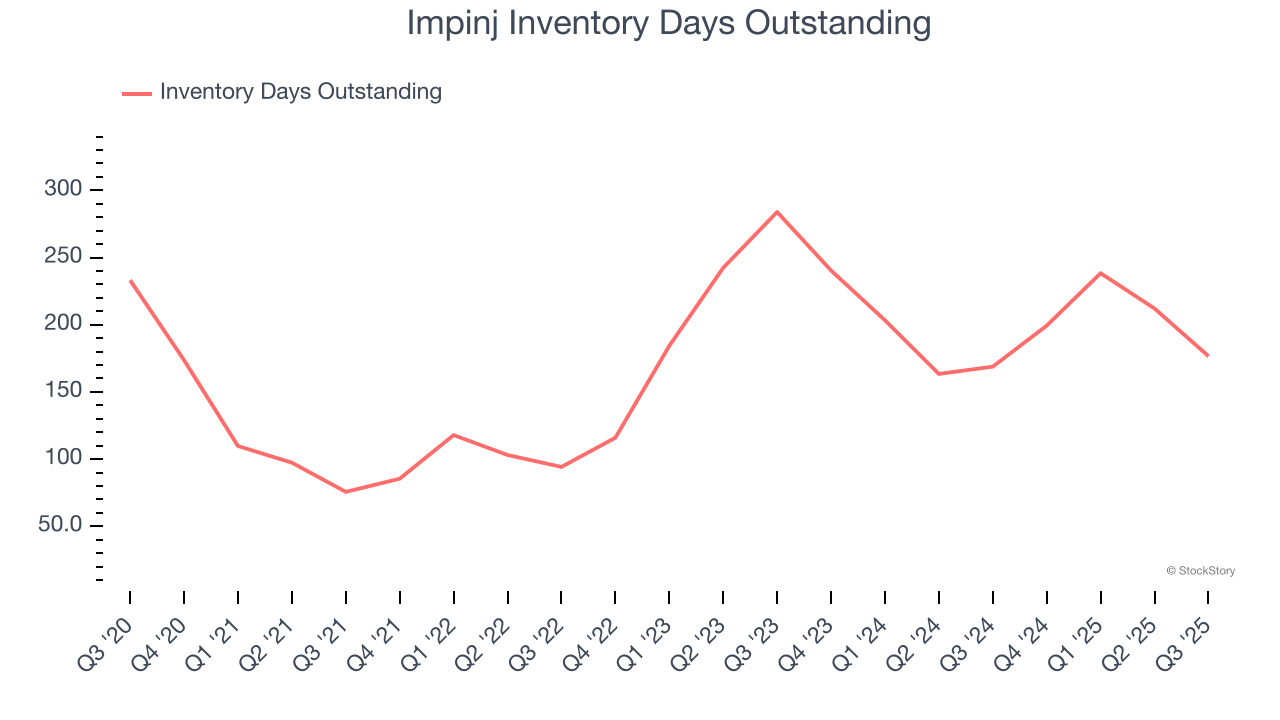
Days Inventory Outstanding (DIO) is an important metric for chipmakers, as it reflects a business’ capital intensity and the cyclical nature of semiconductor supply and demand. In a tight supply environment, inventories tend to be stable, allowing chipmakers to exert pricing power. Steadily increasing DIO can be a warning sign that demand is weak, and if inventories continue to rise, the company may have to downsize production.
This quarter, Impinj’s DIO came in at 177, which is 12 days above its five-year average. These numbers suggest that despite the recent decrease, the company’s inventory levels are higher than what we’ve seen in the past.
Key Takeaways from Impinj’s Q3 Results
We were impressed by Impinj’s strong improvement in inventory levels. We were also glad its EPS outperformed Wall Street’s estimates. Looking ahead, revenue guidance for next quarter was just in line but EBITDA guidance beat. Zooming out, we think this was a good print with some key areas of upside. Investors were likely hoping for more, and shares traded down 9% to $220.95 immediately following the results.
So should you invest in Impinj right now? The latest quarter does matter, but not nearly as much as longer-term fundamentals and valuation, when deciding if the stock is a buy. We cover that in our actionable full research report which you can read here, it’s free for active Edge members.


