
Industrials products and automation company Regal Rexnord (NYSE: RRX). met Wall Streets revenue expectations in Q3 CY2025, with sales up 1.3% year on year to $1.50 billion. Its non-GAAP profit of $2.51 per share was 1% below analysts’ consensus estimates.
Is now the time to buy Regal Rexnord? Find out by accessing our full research report, it’s free for active Edge members.
Regal Rexnord (RRX) Q3 CY2025 Highlights:
- Revenue: $1.50 billion vs analyst estimates of $1.49 billion (1.3% year-on-year growth, in line)
- Adjusted EPS: $2.51 vs analyst expectations of $2.53 (1% miss)
- Adjusted EBITDA: $339.4 million vs analyst estimates of $337 million (22.7% margin, 0.7% beat)
- Management lowered its full-year Adjusted EPS guidance to $9.65 at the midpoint, a 3.5% decrease
- Operating Margin: 11.6%, in line with the same quarter last year
- Free Cash Flow Margin: 11.6%, up from 8.5% in the same quarter last year
- Organic Revenue was flat year on year vs analyst estimates of flat growth (48.3 basis point beat)
- Market Capitalization: $9.61 billion
CEO Louis Pinkham commented, "Our enterprise gained significant momentum in the third quarter by delivering very strong orders, nicely above our expectations. The highlight is positive momentum in data center, where we secured orders worth $135 million in 3Q, plus an additional $60 million to date in 4Q. These orders came in the AMC and PES segments, and we see opportunities in IPS as well. We have been making growth investments in the data center market, which are paying off, and we have plans to do much more. Our capabilities here are positioning us as an emerging scale player, with a bid pipeline that is now over $1 billion."
Company Overview
Headquartered in Milwaukee, Regal Rexnord (NYSE: RRX) provides power transmission and industrial automation products.
Revenue Growth
Examining a company’s long-term performance can provide clues about its quality. Any business can have short-term success, but a top-tier one grows for years. Over the last five years, Regal Rexnord grew its sales at an incredible 15.4% compounded annual growth rate. Its growth beat the average industrials company and shows its offerings resonate with customers.
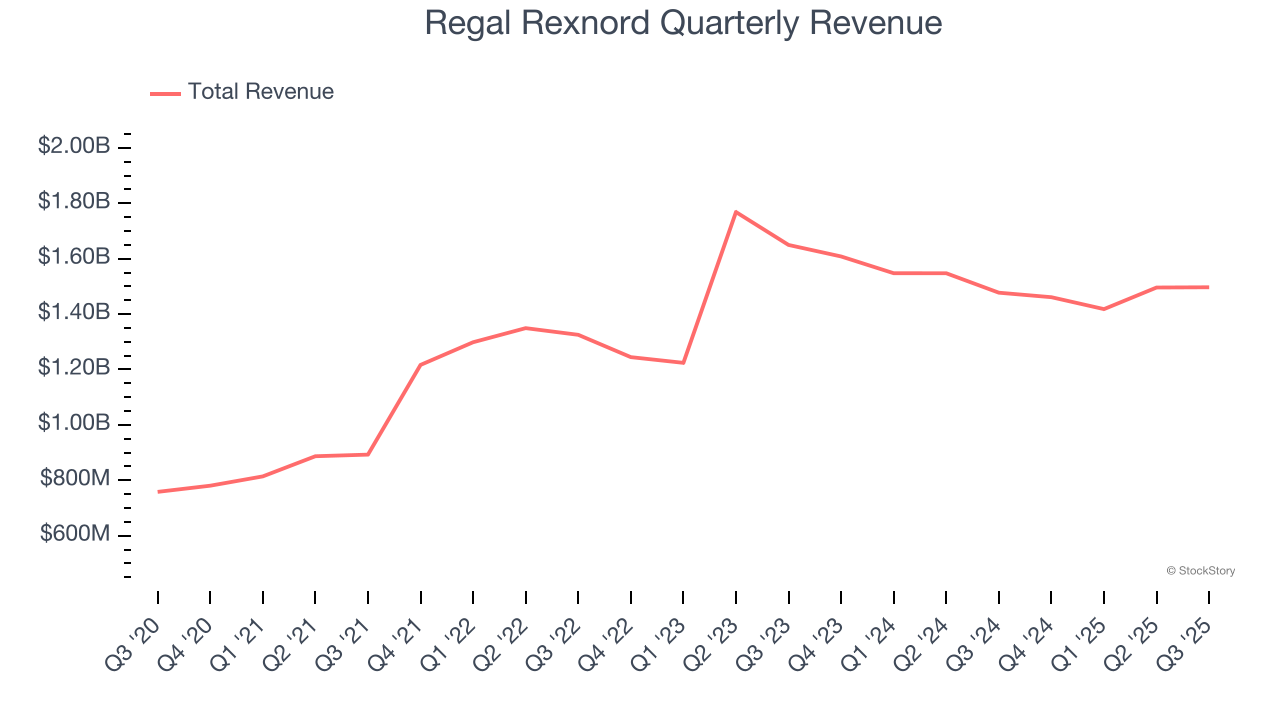
We at StockStory place the most emphasis on long-term growth, but within industrials, a half-decade historical view may miss cycles, industry trends, or a company capitalizing on catalysts such as a new contract win or a successful product line. Regal Rexnord’s recent performance shows its demand has slowed significantly as its revenue was flat over the last two years. 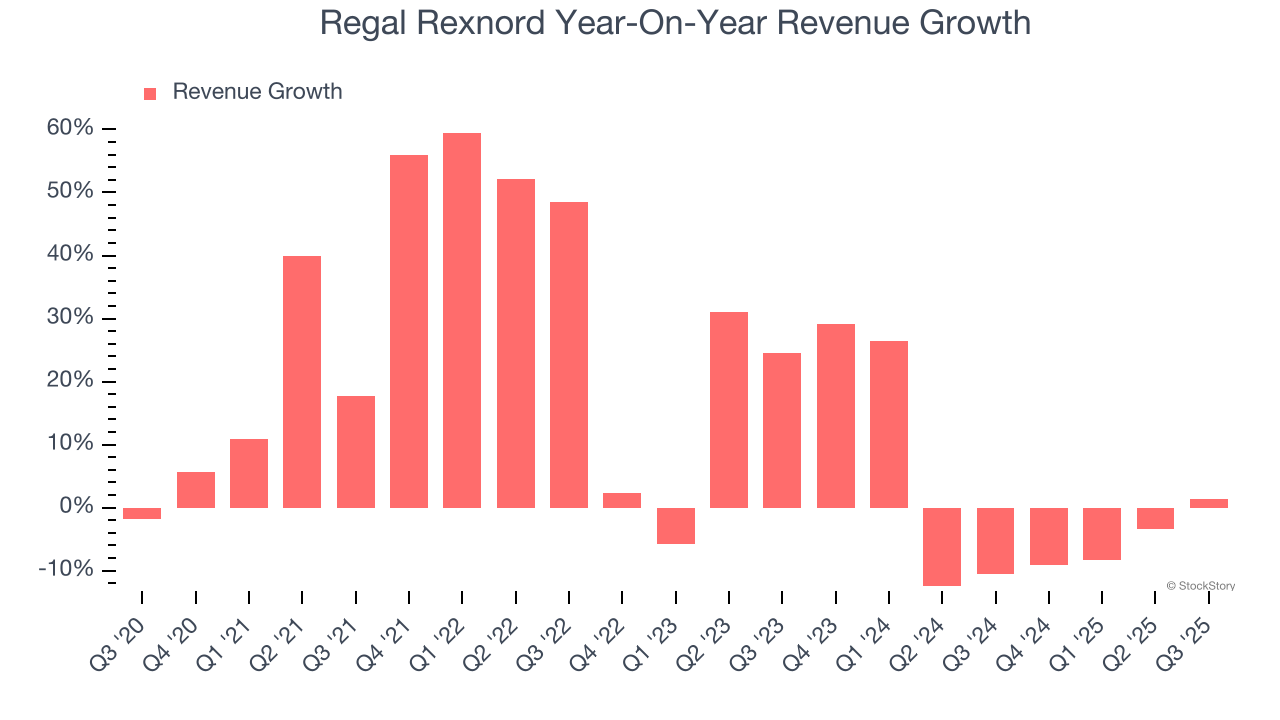
Regal Rexnord also reports organic revenue, which strips out one-time events like acquisitions and currency fluctuations that don’t accurately reflect its fundamentals. Over the last two years, Regal Rexnord’s organic revenue averaged 3.6% year-on-year declines. Because this number is lower than its two-year revenue growth, we can see that some mixture of acquisitions and foreign exchange rates boosted its headline results. 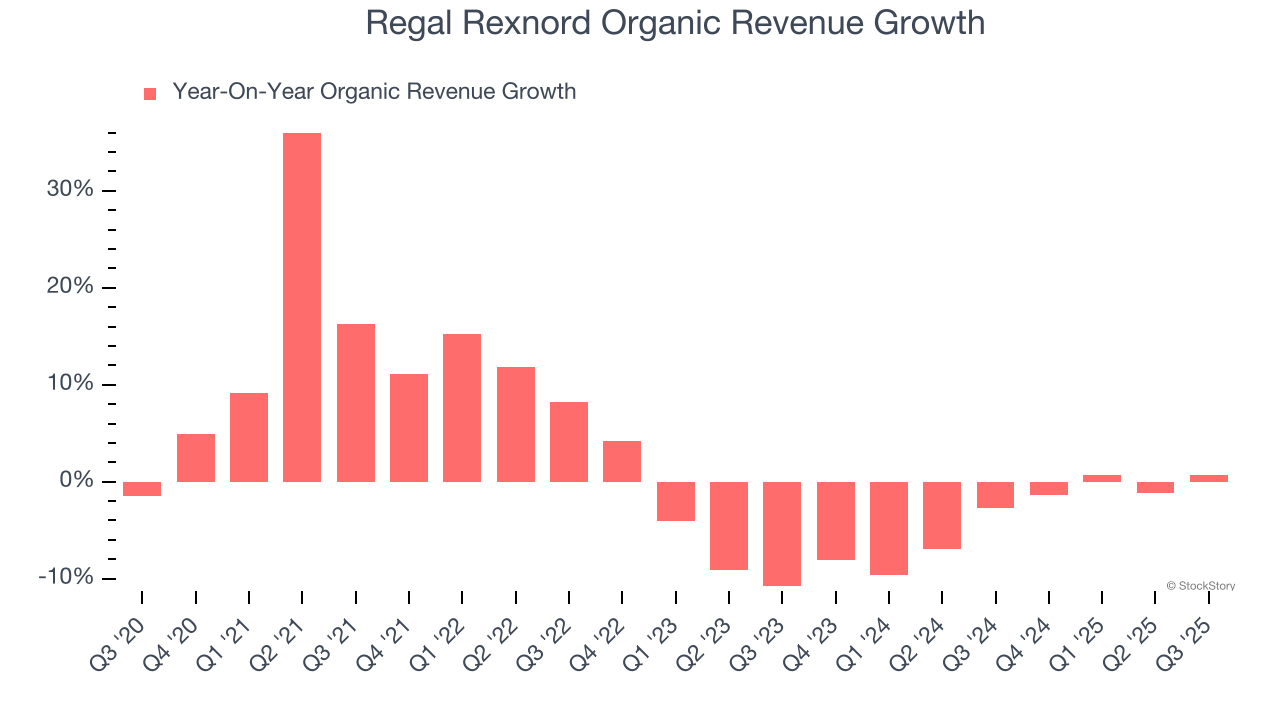
This quarter, Regal Rexnord grew its revenue by 1.3% year on year, and its $1.50 billion of revenue was in line with Wall Street’s estimates.
Looking ahead, sell-side analysts expect revenue to grow 3.9% over the next 12 months. Although this projection implies its newer products and services will catalyze better top-line performance, it is still below the sector average.
Today’s young investors won’t have read the timeless lessons in Gorilla Game: Picking Winners In High Technology because it was written more than 20 years ago when Microsoft and Apple were first establishing their supremacy. But if we apply the same principles, then enterprise software stocks leveraging their own generative AI capabilities may well be the Gorillas of the future. So, in that spirit, we are excited to present our Special Free Report on a profitable, fast-growing enterprise software stock that is already riding the automation wave and looking to catch the generative AI next.
Operating Margin
Regal Rexnord has managed its cost base well over the last five years. It demonstrated solid profitability for an industrials business, producing an average operating margin of 10%. This result isn’t too surprising as its gross margin gives it a favorable starting point.
Looking at the trend in its profitability, Regal Rexnord’s operating margin decreased by 1.2 percentage points over the last five years. This raises questions about the company’s expense base because its revenue growth should have given it leverage on its fixed costs, resulting in better economies of scale and profitability.
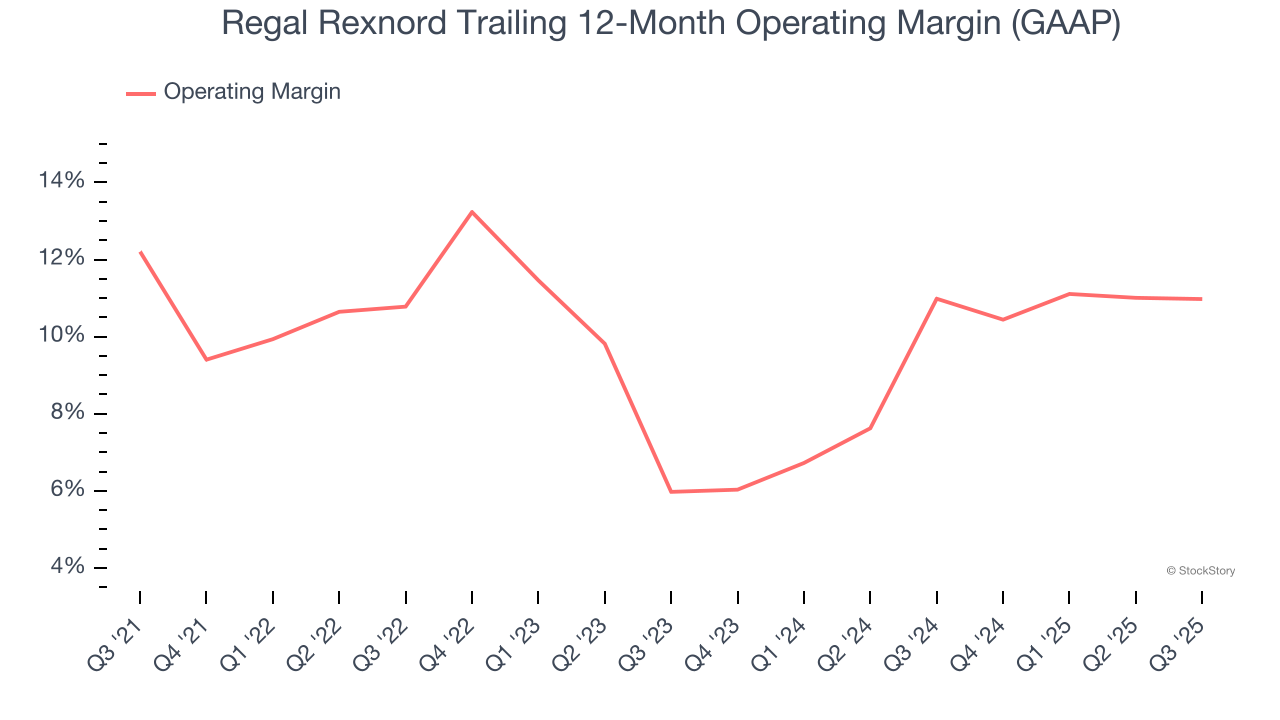
In Q3, Regal Rexnord generated an operating margin profit margin of 11.6%, in line with the same quarter last year. This indicates the company’s cost structure has recently been stable.
Earnings Per Share
Revenue trends explain a company’s historical growth, but the long-term change in earnings per share (EPS) points to the profitability of that growth – for example, a company could inflate its sales through excessive spending on advertising and promotions.
Regal Rexnord’s EPS grew at a remarkable 12.6% compounded annual growth rate over the last five years. However, this performance was lower than its 15.4% annualized revenue growth, telling us the company became less profitable on a per-share basis as it expanded.
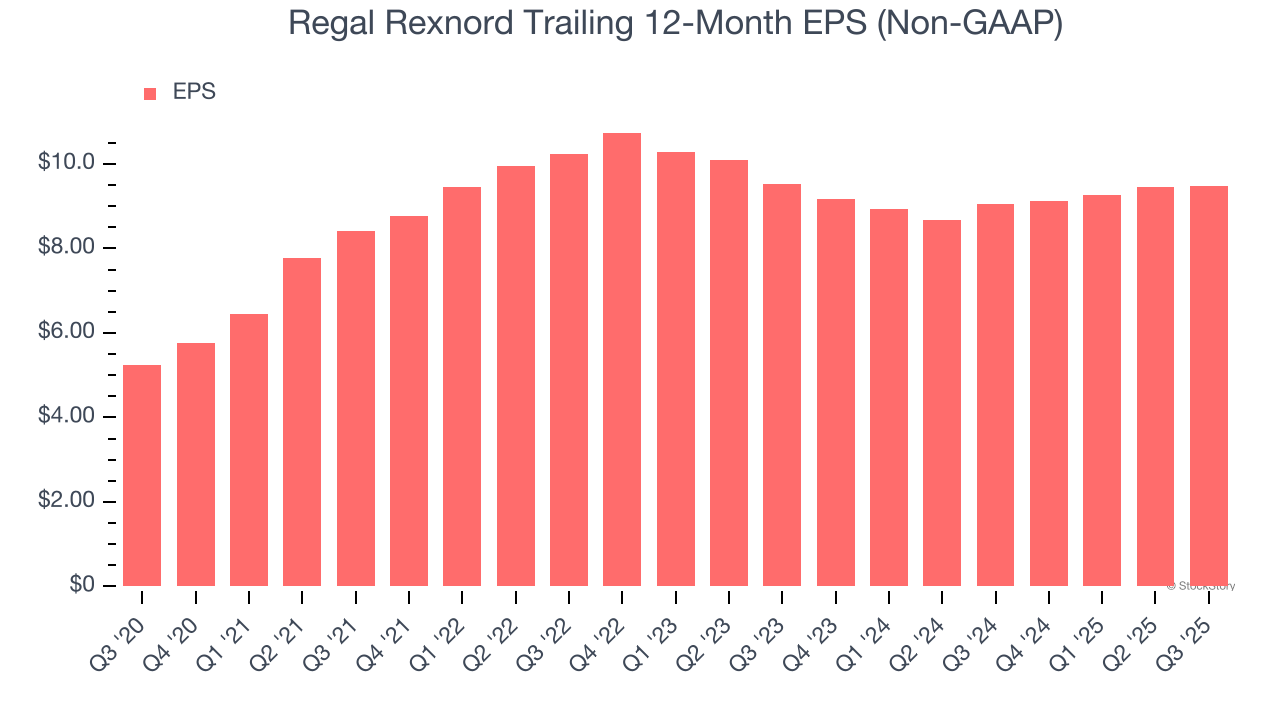
Diving into the nuances of Regal Rexnord’s earnings can give us a better understanding of its performance. As we mentioned earlier, Regal Rexnord’s operating margin was flat this quarter but declined by 1.2 percentage points over the last five years. Its share count also grew by 63.2%, meaning the company not only became less efficient with its operating expenses but also diluted its shareholders. 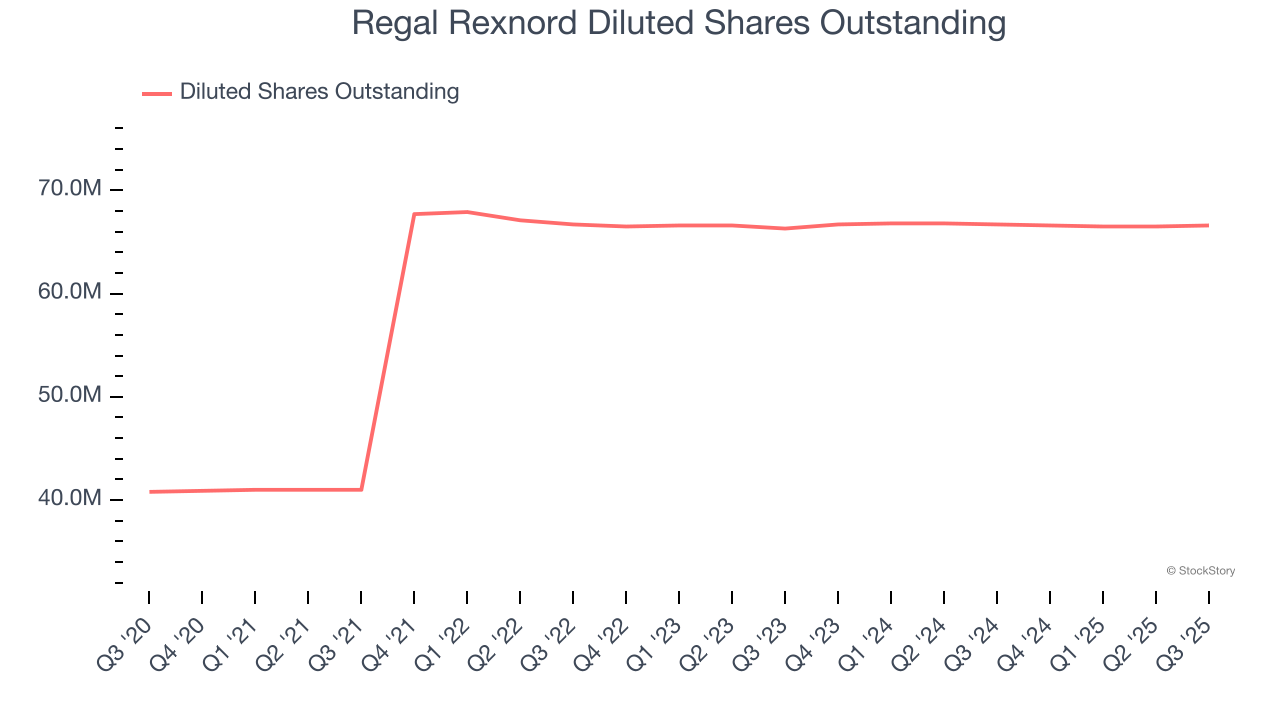
Like with revenue, we analyze EPS over a more recent period because it can provide insight into an emerging theme or development for the business.
For Regal Rexnord, EPS didn’t budge over the last two years, a regression from its five-year trend. We hope it can revert to earnings growth in the coming years.
In Q3, Regal Rexnord reported adjusted EPS of $2.51, up from $2.49 in the same quarter last year. This print was close to analysts’ estimates. Over the next 12 months, Wall Street expects Regal Rexnord’s full-year EPS of $9.48 to grow 15.5%.
Key Takeaways from Regal Rexnord’s Q3 Results
It was good to see Regal Rexnord meet analysts’ organic revenue expectations this quarter. We were also happy its revenue was in line with Wall Street’s estimates. On the other hand, its full-year EPS guidance missed and its EPS fell a bit short of Wall Street’s estimates. Overall, this was a softer quarter. The stock remained flat at $150.63 immediately following the results.
Is Regal Rexnord an attractive investment opportunity at the current price? We think that the latest quarter is only one piece of the longer-term business quality puzzle. Quality, when combined with valuation, can help determine if the stock is a buy. We cover that in our actionable full research report which you can read here, it’s free for active Edge members.


