
Cybersecurity exposure management company Tenable (NASDAQ: TENB) reported Q3 CY2025 results exceeding the market’s revenue expectations, with sales up 11.2% year on year to $252.4 million. The company expects next quarter’s revenue to be around $251.1 million, close to analysts’ estimates. Its non-GAAP profit of $0.42 per share was 13.5% above analysts’ consensus estimates.
Is now the time to buy Tenable? Find out by accessing our full research report, it’s free for active Edge members.
Tenable (TENB) Q3 CY2025 Highlights:
- Revenue: $252.4 million vs analyst estimates of $247.3 million (11.2% year-on-year growth, 2.1% beat)
- Adjusted EPS: $0.42 vs analyst estimates of $0.37 (13.5% beat)
- Adjusted Operating Income: $51.44 million vs analyst estimates of $53.2 million (20.4% margin, 3.3% miss)
- Revenue Guidance for Q4 CY2025 is $251.1 million at the midpoint, roughly in line with what analysts were expecting
- Management raised its full-year Adjusted EPS guidance to $1.53 at the midpoint, a 2.3% increase
- Operating Margin: 2.8%, up from -0.9% in the same quarter last year
- Free Cash Flow Margin: 20.5%, up from 15.1% in the previous quarter
- Billings: $267.5 million at quarter end, up 7.5% year on year
- Market Capitalization: $3.68 billion
"We delivered better-than-expected results on both the top and bottom line driven by strong demand for our Tenable One Exposure Management platform," said Steve Vintz, Co-CEO of Tenable.
Company Overview
Starting with the widely-used Nessus vulnerability scanner first released in 1998, Tenable (NASDAQ: TENB) provides exposure management solutions that help organizations identify, assess, and prioritize cybersecurity vulnerabilities across their IT infrastructure and cloud environments.
Revenue Growth
A company’s long-term performance is an indicator of its overall quality. Any business can have short-term success, but a top-tier one grows for years. Over the last five years, Tenable grew its sales at a decent 18.4% compounded annual growth rate. Its growth was slightly above the average software company and shows its offerings resonate with customers.
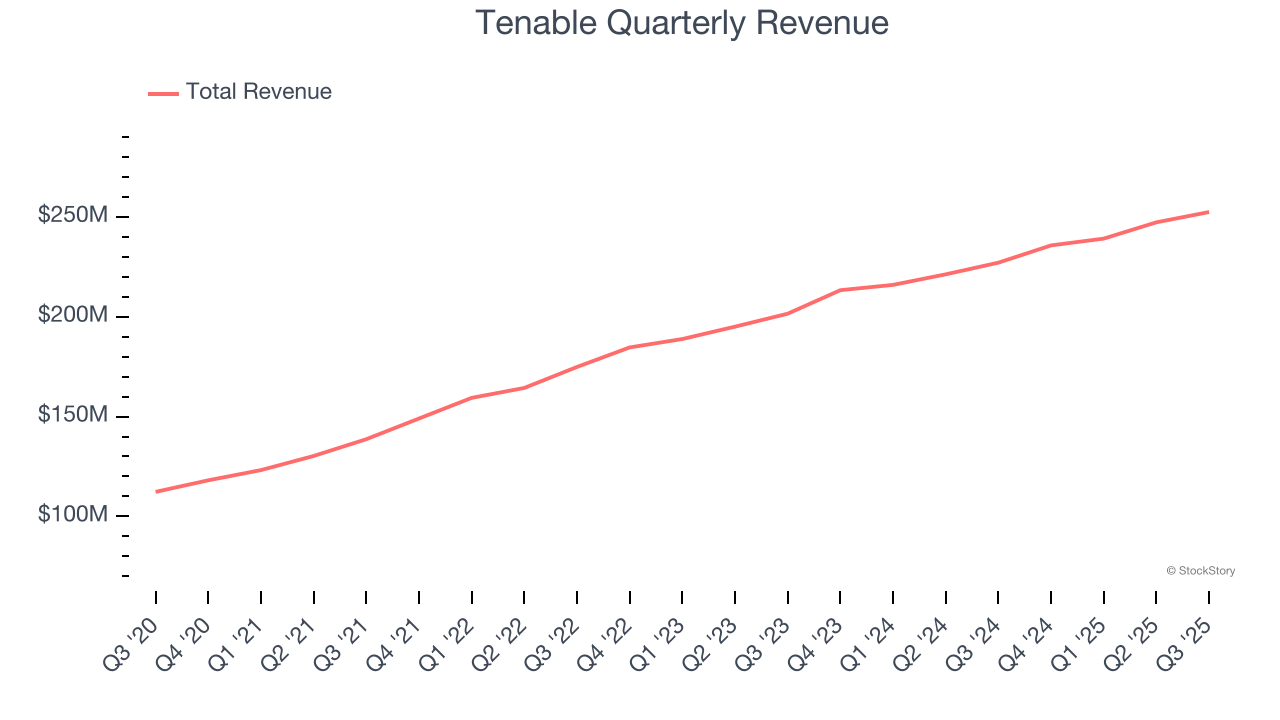
Long-term growth is the most important, but within software, a half-decade historical view may miss new innovations or demand cycles. Tenable’s recent performance shows its demand has slowed as its annualized revenue growth of 12.5% over the last two years was below its five-year trend. 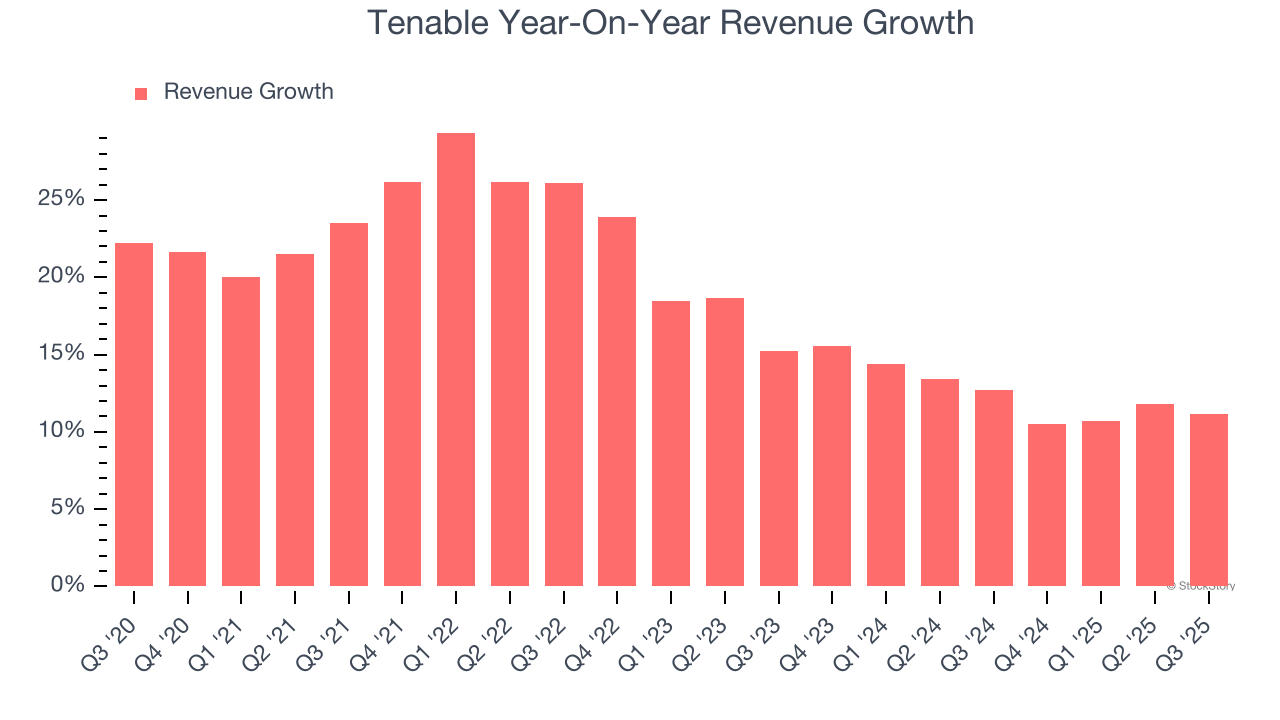
This quarter, Tenable reported year-on-year revenue growth of 11.2%, and its $252.4 million of revenue exceeded Wall Street’s estimates by 2.1%. Company management is currently guiding for a 6.5% year-on-year increase in sales next quarter.
Looking further ahead, sell-side analysts expect revenue to grow 6.8% over the next 12 months, a deceleration versus the last two years. This projection is underwhelming and indicates its products and services will see some demand headwinds.
Software is eating the world and there is virtually no industry left that has been untouched by it. That drives increasing demand for tools helping software developers do their jobs, whether it be monitoring critical cloud infrastructure, integrating audio and video functionality, or ensuring smooth content streaming. Click here to access a free report on our 3 favorite stocks to play this generational megatrend.
Billings
Billings is a non-GAAP metric that is often called “cash revenue” because it shows how much money the company has collected from customers in a certain period. This is different from revenue, which must be recognized in pieces over the length of a contract.
Tenable’s billings came in at $267.5 million in Q3, and over the last four quarters, its growth was underwhelming as it averaged 10.6% year-on-year increases. This performance mirrored its total sales and suggests that increasing competition is causing challenges in acquiring/retaining customers. 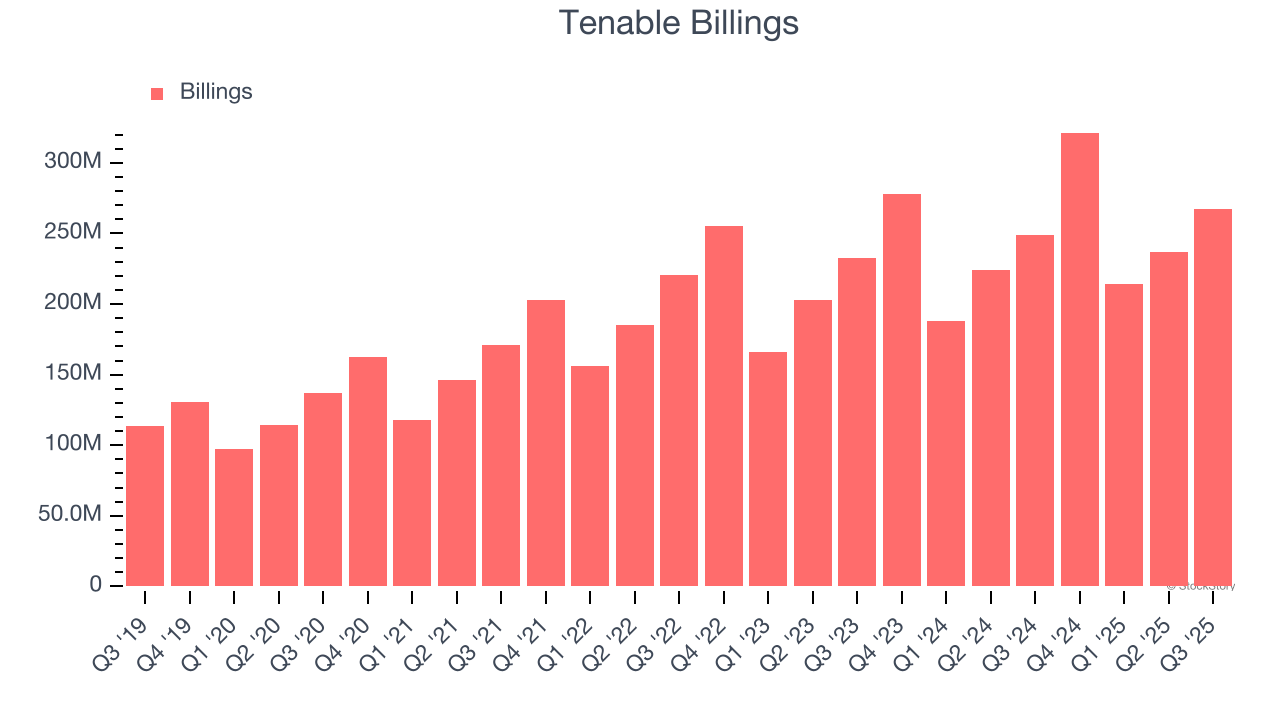
Customer Acquisition Efficiency
The customer acquisition cost (CAC) payback period represents the months required to recover the cost of acquiring a new customer. Essentially, it’s the break-even point for sales and marketing investments. A shorter CAC payback period is ideal, as it implies better returns on investment and business scalability.
It’s relatively expensive for Tenable to acquire new customers as its CAC payback period checked in at 70 months this quarter. The company’s slow recovery of its sales and marketing expenses indicates it operates in a highly competitive market and must invest to stand out, even if the return on that investment is low. 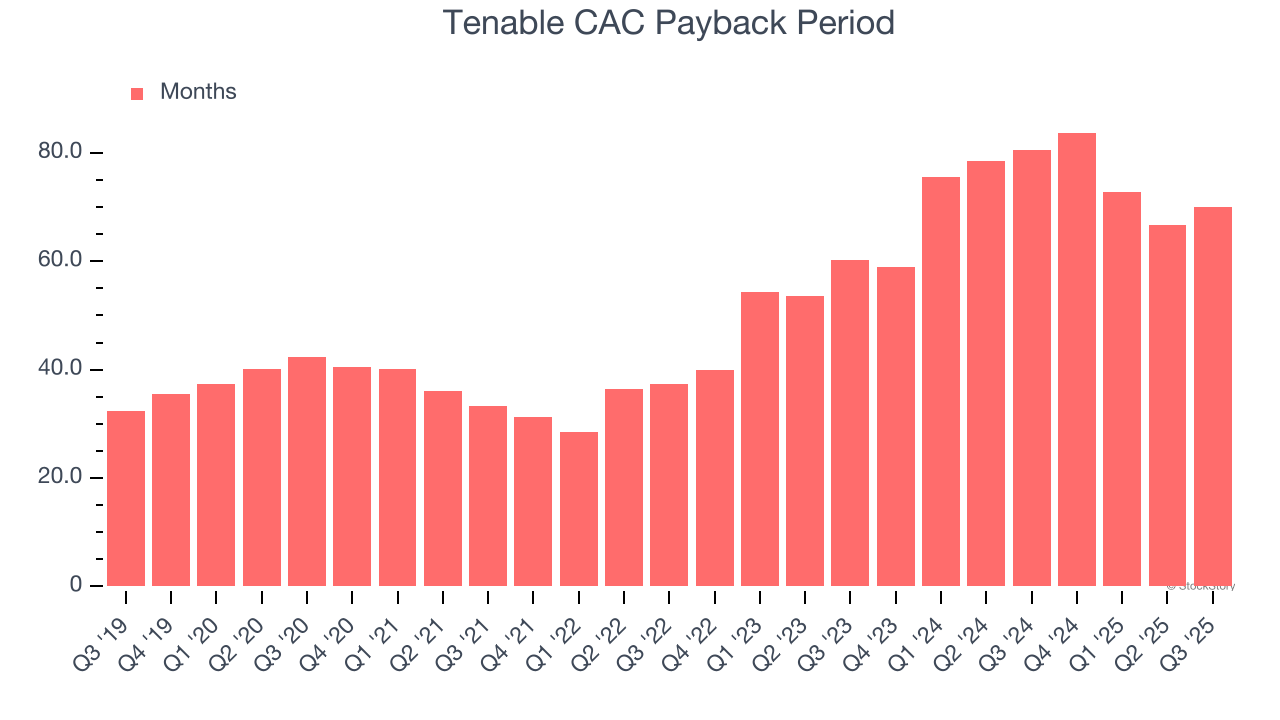
Key Takeaways from Tenable’s Q3 Results
It was great to see Tenable’s full-year EPS guidance top analysts’ expectations. We were also happy its revenue outperformed Wall Street’s estimates. On the other hand, its billings and adjusted operating income fell short. Overall, this quarter could have been better. The stock traded up 1.1% to $28.94 immediately after reporting.
Is Tenable an attractive investment opportunity right now? We think that the latest quarter is only one piece of the longer-term business quality puzzle. Quality, when combined with valuation, can help determine if the stock is a buy. We cover that in our actionable full research report which you can read here, it’s free for active Edge members.


