Biotechnology company United Therapeutics (NASDAQ: UTHR) fell short of the markets revenue expectations in Q3 CY2025, but sales rose 6.8% year on year to $799.5 million. Its GAAP profit of $7.16 per share was 2.3% above analysts’ consensus estimates.
Is now the time to buy United Therapeutics? Find out by accessing our full research report, it’s free for active Edge members.
United Therapeutics (UTHR) Q3 CY2025 Highlights:
- Revenue: $799.5 million vs analyst estimates of $812.2 million (6.8% year-on-year growth, 1.6% miss)
- EPS (GAAP): $7.16 vs analyst estimates of $7.00 (2.3% beat)
- Operating Margin: 48.6%, up from 45.8% in the same quarter last year
- Market Capitalization: $18.78 billion
"Our commercial and clinical teams continue to deliver record results, validating our strategic objectives," said Martine Rothblatt, Chairperson and Chief Executive Officer of United Therapeutics.
Company Overview
Founded by a mother seeking treatment for her daughter's pulmonary arterial hypertension, United Therapeutics (NASDAQ: UTHR) develops and commercializes medications for chronic lung diseases and other life-threatening conditions, with a focus on pulmonary hypertension treatments.
Revenue Growth
A company’s long-term sales performance is one signal of its overall quality. Any business can have short-term success, but a top-tier one grows for years. Thankfully, United Therapeutics’s 17.3% annualized revenue growth over the last five years was impressive. Its growth surpassed the average healthcare company and shows its offerings resonate with customers, a great starting point for our analysis.
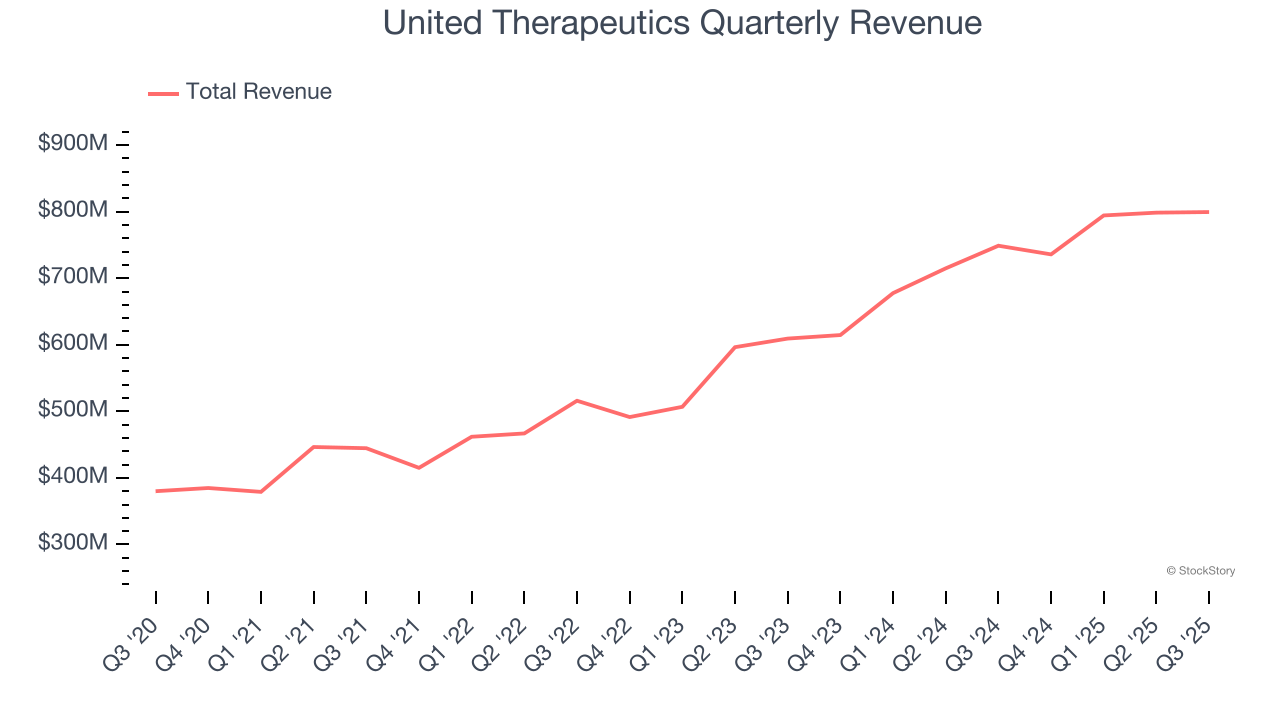
We at StockStory place the most emphasis on long-term growth, but within healthcare, a half-decade historical view may miss recent innovations or disruptive industry trends. United Therapeutics’s annualized revenue growth of 19.1% over the last two years is above its five-year trend, suggesting its demand was strong and recently accelerated. 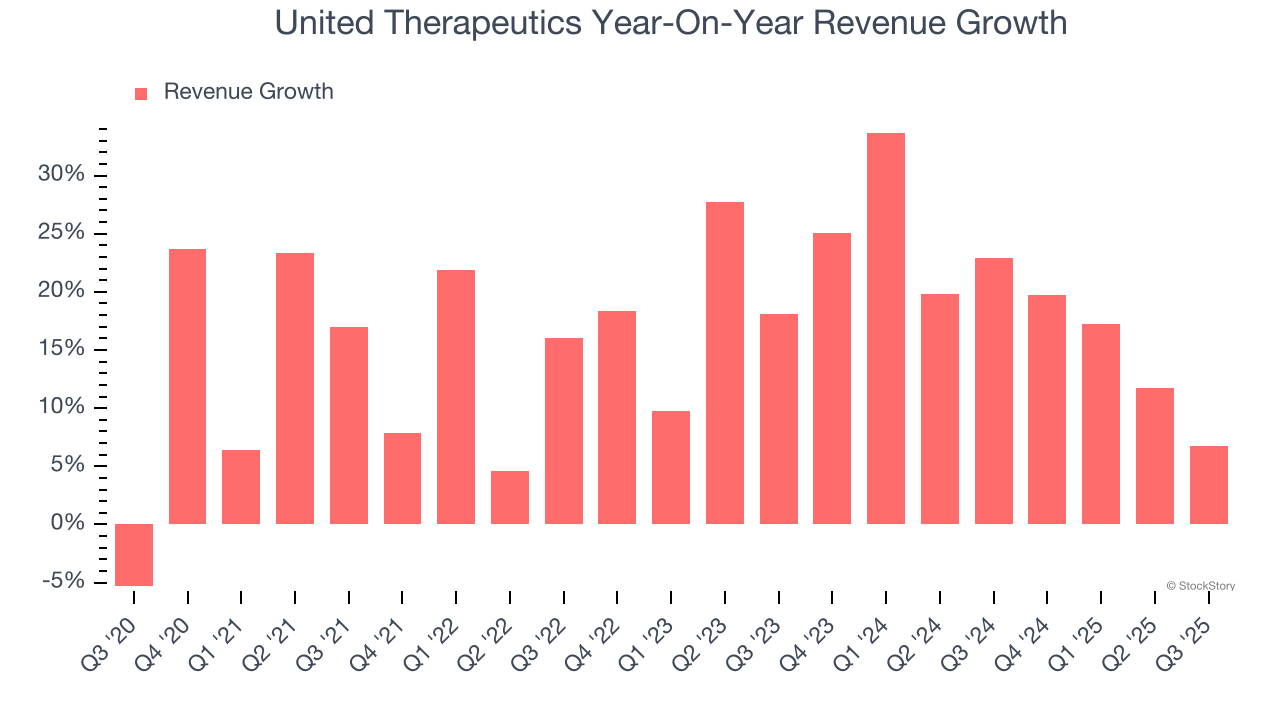
This quarter, United Therapeutics’s revenue grew by 6.8% year on year to $799.5 million, missing Wall Street’s estimates.
Looking ahead, sell-side analysts expect revenue to decline by 6% over the next 12 months, a deceleration versus the last two years. This projection doesn't excite us and implies its products and services will face some demand challenges. At least the company is tracking well in other measures of financial health.
Today’s young investors won’t have read the timeless lessons in Gorilla Game: Picking Winners In High Technology because it was written more than 20 years ago when Microsoft and Apple were first establishing their supremacy. But if we apply the same principles, then enterprise software stocks leveraging their own generative AI capabilities may well be the Gorillas of the future. So, in that spirit, we are excited to present our Special Free Report on a profitable, fast-growing enterprise software stock that is already riding the automation wave and looking to catch the generative AI next.
Operating Margin
United Therapeutics has been a well-oiled machine over the last five years. It demonstrated elite profitability for a healthcare business, boasting an average operating margin of 45.7%.
Looking at the trend in its profitability, United Therapeutics’s operating margin rose by 20.5 percentage points over the last five years, as its sales growth gave it immense operating leverage. Zooming into its more recent performance, however, we can see the company’s margin has decreased by 2.2 percentage points on a two-year basis. Given its business quality, we’re optimistic that United Therapeutics can correct course and return to expansion.
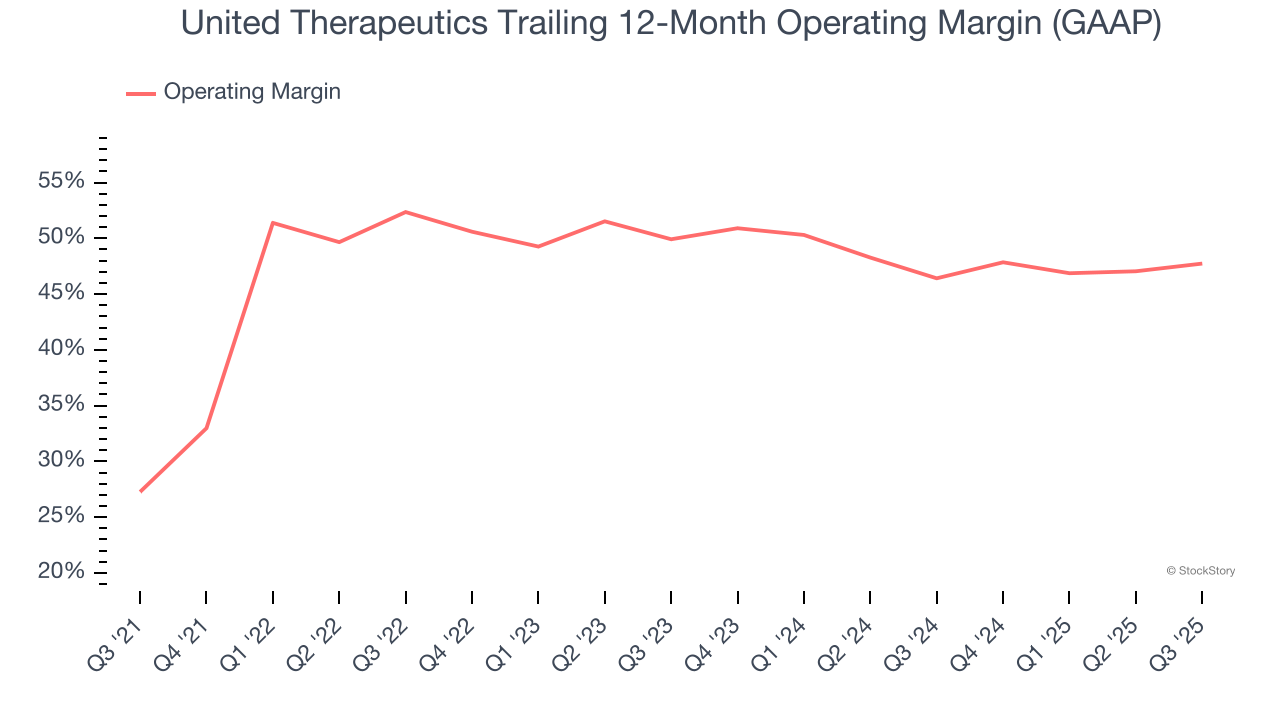
In Q3, United Therapeutics generated an operating margin profit margin of 48.6%, up 2.8 percentage points year on year. This increase was a welcome development and shows it was more efficient.
Earnings Per Share
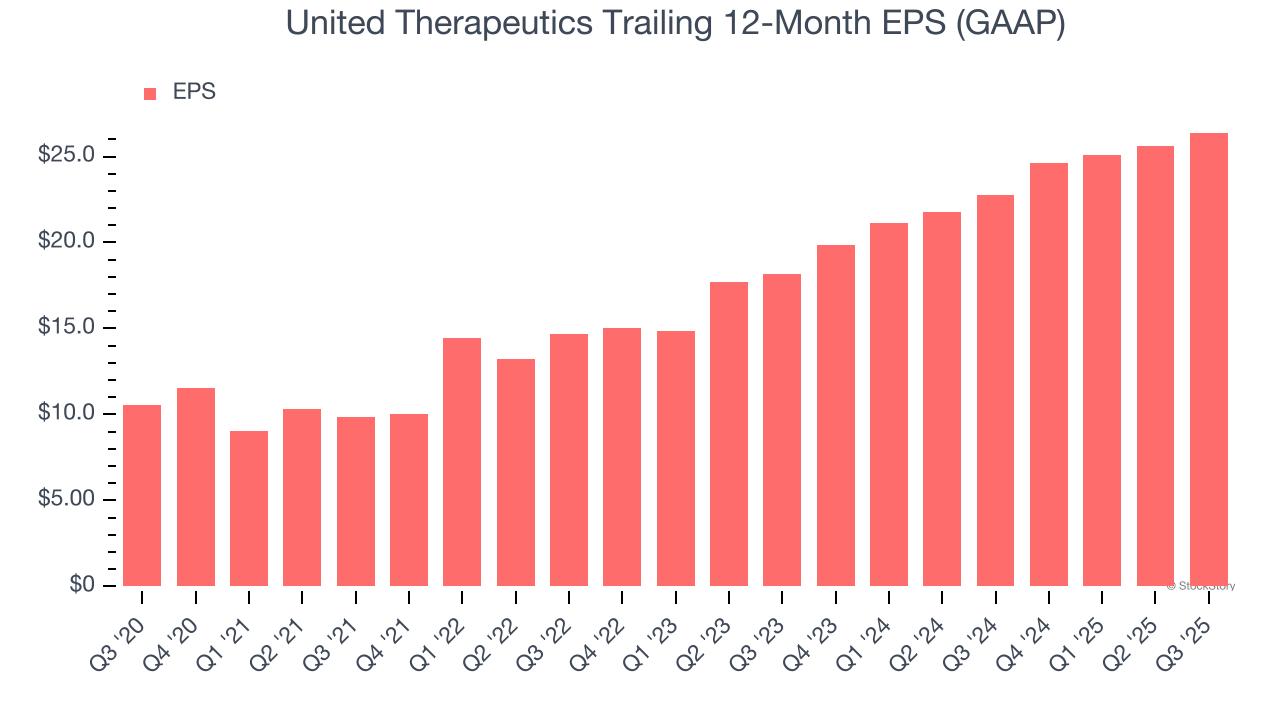
We track the long-term change in earnings per share (EPS) for the same reason as long-term revenue growth. Compared to revenue, however, EPS highlights whether a company’s growth is profitable.
United Therapeutics’s EPS grew at an astounding 20.1% compounded annual growth rate over the last five years, higher than its 17.3% annualized revenue growth. This tells us the company became more profitable on a per-share basis as it expanded.
We can take a deeper look into United Therapeutics’s earnings to better understand the drivers of its performance. As we mentioned earlier, United Therapeutics’s operating margin expanded by 20.5 percentage points over the last five years. This was the most relevant factor (aside from the revenue impact) behind its higher earnings; interest expenses and taxes can also affect EPS but don’t tell us as much about a company’s fundamentals.
In Q3, United Therapeutics reported EPS of $7.16, up from $6.39 in the same quarter last year. This print beat analysts’ estimates by 2.3%. Over the next 12 months, Wall Street expects United Therapeutics’s full-year EPS of $26.39 to grow 5.3%.
Key Takeaways from United Therapeutics’s Q3 Results
Revenue fell short of expectations, making for a softer quarter. The stock traded down 2.4% to $405 immediately following the results.
United Therapeutics’s latest earnings report disappointed. One quarter doesn’t define a company’s quality, so let’s explore whether the stock is a buy at the current price. The latest quarter does matter, but not nearly as much as longer-term fundamentals and valuation, when deciding if the stock is a buy. We cover that in our actionable full research report which you can read here, it’s free for active Edge members.