Equipment distributor Watsco (NYSE: WSO) missed Wall Street’s revenue expectations in Q3 CY2025, with sales falling 4.3% year on year to $2.07 billion. Its GAAP profit of $3.98 per share was 7.3% below analysts’ consensus estimates.
Is now the time to buy Watsco? Find out by accessing our full research report, it’s free for active Edge members.
Watsco (WSO) Q3 CY2025 Highlights:
- Revenue: $2.07 billion vs analyst estimates of $2.12 billion (4.3% year-on-year decline, 2.6% miss)
- EPS (GAAP): $3.98 vs analyst expectations of $4.29 (7.3% miss)
- Adjusted EBITDA: $254.8 million vs analyst estimates of $264.1 million (12.3% margin, 3.5% miss)
- Operating Margin: 11.4%, in line with the same quarter last year
- Free Cash Flow Margin: 16.7%, up from 10.3% in the same quarter last year
- Market Capitalization: $13.71 billion
Company Overview
Originally a manufacturing company, Watsco (NYSE: WSO) today only distributes air conditioning, heating, and refrigeration equipment, as well as related parts and supplies.
Revenue Growth
A company’s long-term sales performance is one signal of its overall quality. Any business can put up a good quarter or two, but many enduring ones grow for years. Luckily, Watsco’s sales grew at a decent 8.3% compounded annual growth rate over the last five years. Its growth was slightly above the average industrials company and shows its offerings resonate with customers.
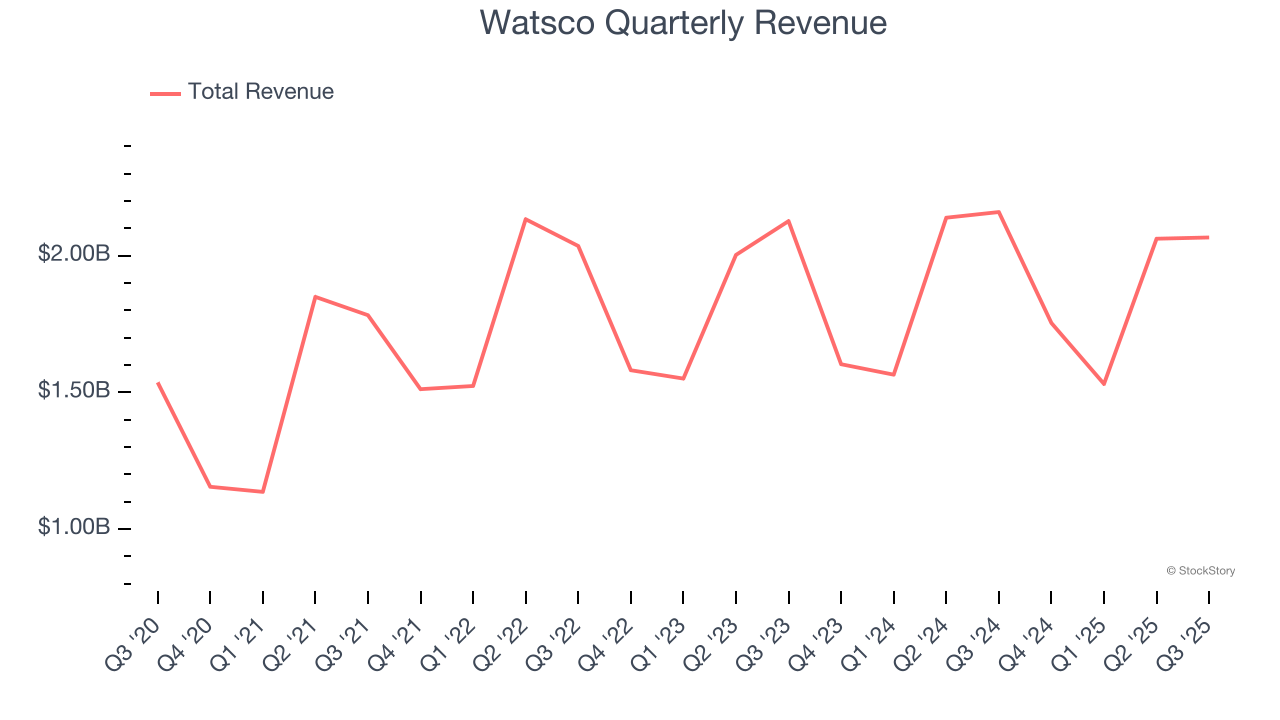
We at StockStory place the most emphasis on long-term growth, but within industrials, a half-decade historical view may miss cycles, industry trends, or a company capitalizing on catalysts such as a new contract win or a successful product line. Watsco’s recent performance shows its demand has slowed as its annualized revenue growth of 1% over the last two years was below its five-year trend. 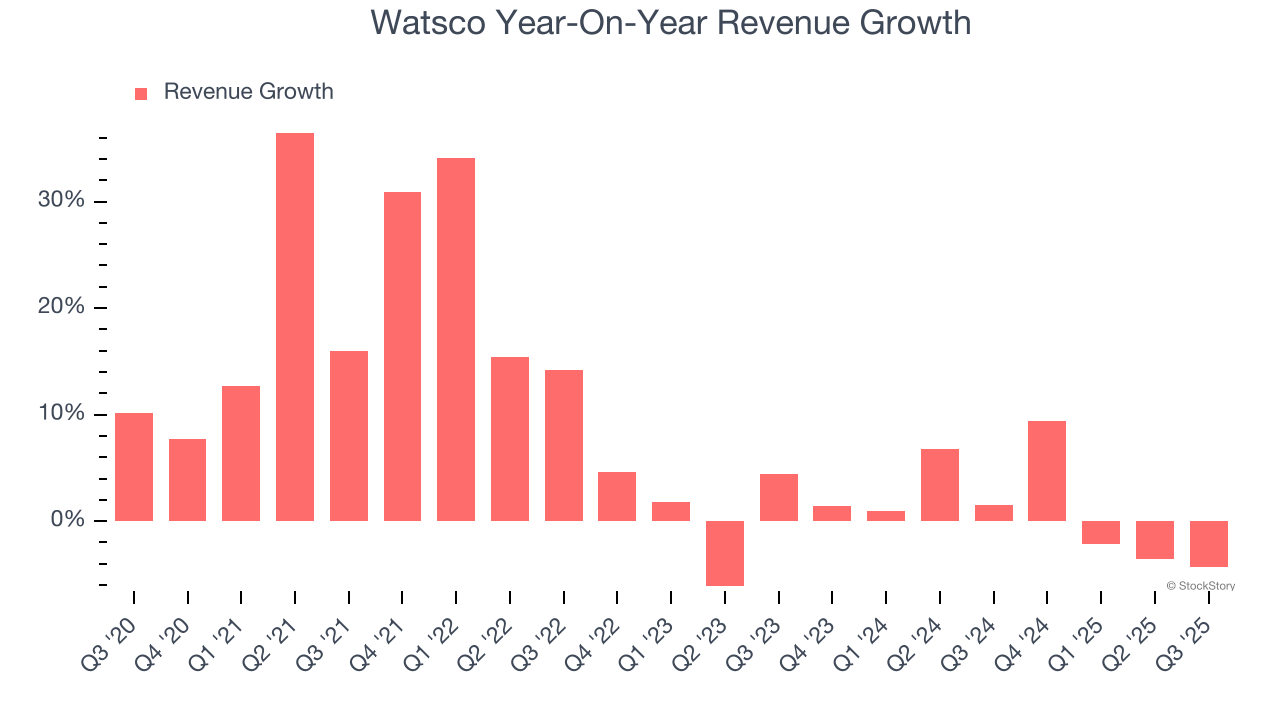
This quarter, Watsco missed Wall Street’s estimates and reported a rather uninspiring 4.3% year-on-year revenue decline, generating $2.07 billion of revenue.
Looking ahead, sell-side analysts expect revenue to grow 5% over the next 12 months. Although this projection indicates its newer products and services will catalyze better top-line performance, it is still below the sector average.
Today’s young investors won’t have read the timeless lessons in Gorilla Game: Picking Winners In High Technology because it was written more than 20 years ago when Microsoft and Apple were first establishing their supremacy. But if we apply the same principles, then enterprise software stocks leveraging their own generative AI capabilities may well be the Gorillas of the future. So, in that spirit, we are excited to present our Special Free Report on a profitable, fast-growing enterprise software stock that is already riding the automation wave and looking to catch the generative AI next.
Operating Margin
Operating margin is a key measure of profitability. Think of it as net income - the bottom line - excluding the impact of taxes and interest on debt, which are less connected to business fundamentals.
Watsco’s operating margin might fluctuated slightly over the last 12 months but has remained more or less the same, averaging 10.6% over the last five years. This profitability was solid for an industrials business and shows it’s an efficient company that manages its expenses well. This result was particularly impressive because of its low gross margin, which is mostly a factor of what it sells and takes huge shifts to move meaningfully. Companies have more control over their operating margins, and it’s a show of well-managed operations if they’re high when gross margins are low.
Analyzing the trend in its profitability, Watsco’s operating margin might fluctuated slightly but has generally stayed the same over the last five years. This raises questions about the company’s expense base because its revenue growth should have given it leverage on its fixed costs, resulting in better economies of scale and profitability.
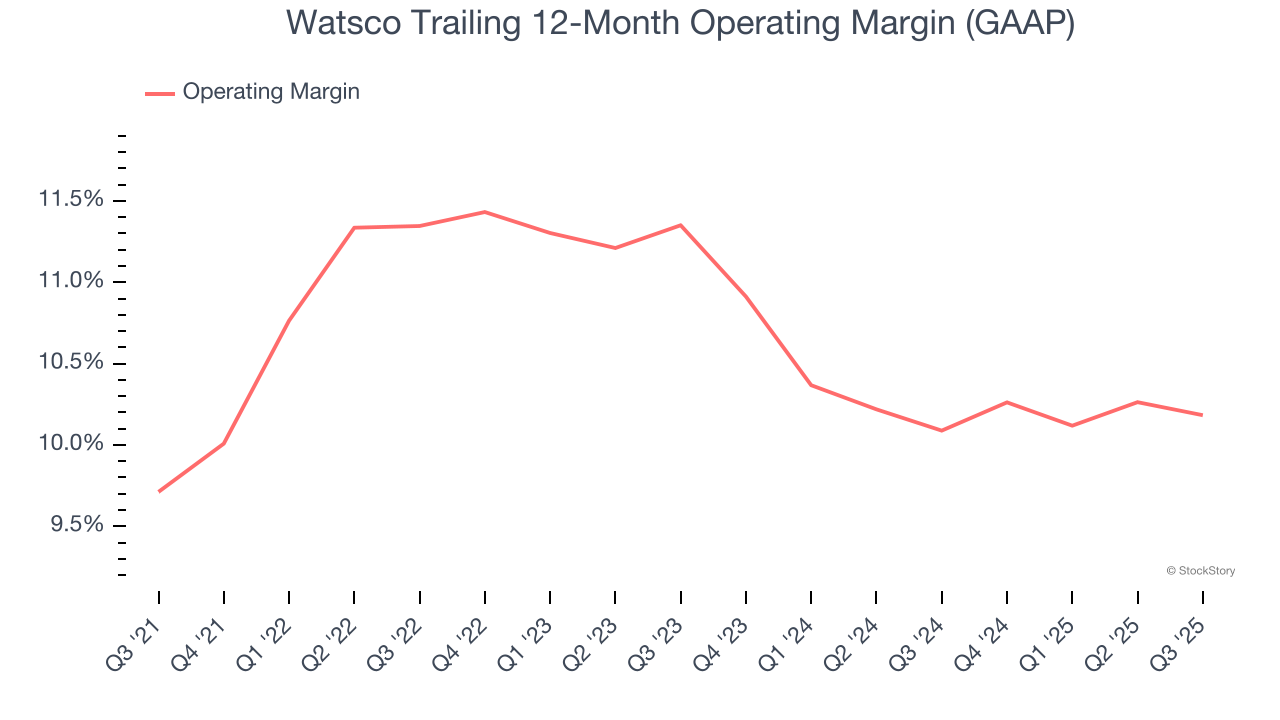
This quarter, Watsco generated an operating margin profit margin of 11.4%, in line with the same quarter last year. This indicates the company’s cost structure has recently been stable.
Earnings Per Share
We track the long-term change in earnings per share (EPS) for the same reason as long-term revenue growth. Compared to revenue, however, EPS highlights whether a company’s growth is profitable.
Watsco’s EPS grew at a remarkable 14% compounded annual growth rate over the last five years, higher than its 8.3% annualized revenue growth. This tells us the company became more profitable on a per-share basis as it expanded.
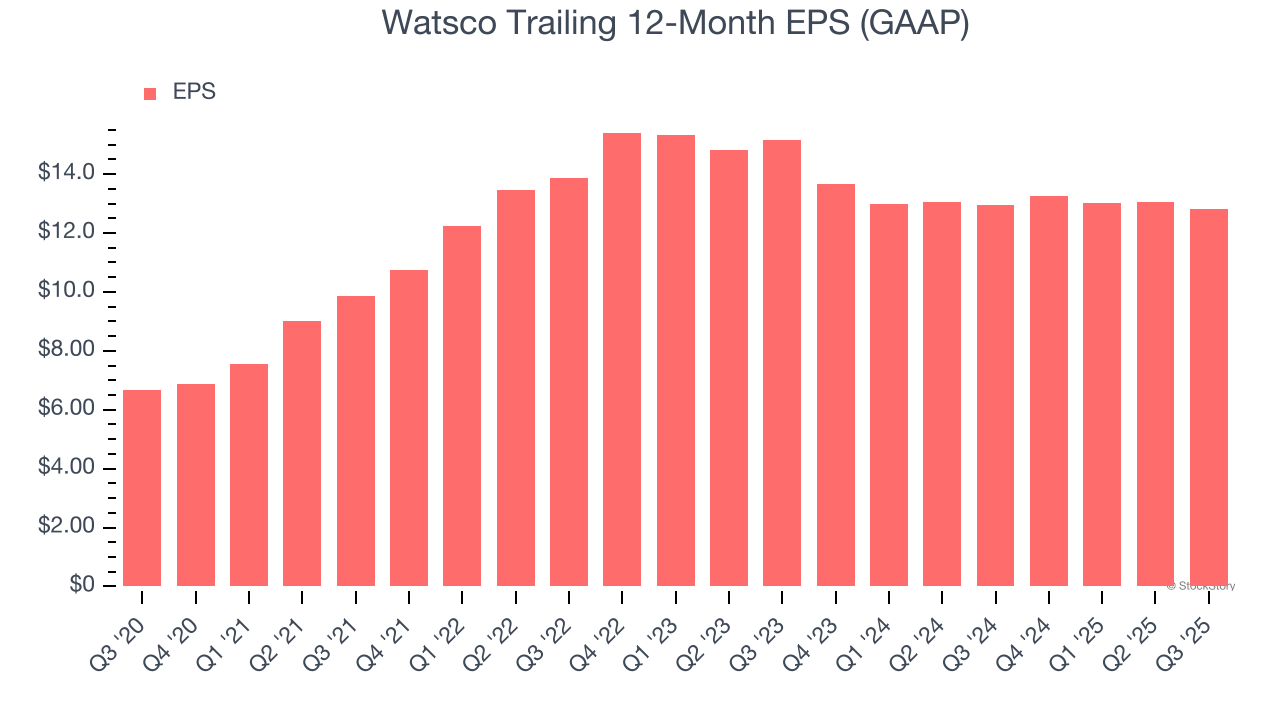
Like with revenue, we analyze EPS over a more recent period because it can provide insight into an emerging theme or development for the business.
For Watsco, its two-year annual EPS declines of 8.1% mark a reversal from its (seemingly) healthy five-year trend. We hope Watsco can return to earnings growth in the future.
In Q3, Watsco reported EPS of $3.98, down from $4.22 in the same quarter last year. This print missed analysts’ estimates, but we care more about long-term EPS growth than short-term movements. Over the next 12 months, Wall Street expects Watsco’s full-year EPS of $12.80 to grow 9.8%.
Key Takeaways from Watsco’s Q3 Results
We struggled to find many positives in these results. Its revenue missed and its EPS fell short of Wall Street’s estimates. Overall, this was a softer quarter. The stock traded down 1.8% to $352 immediately following the results.
Watsco didn’t show it’s best hand this quarter, but does that create an opportunity to buy the stock right now? When making that decision, it’s important to consider its valuation, business qualities, as well as what has happened in the latest quarter. We cover that in our actionable full research report which you can read here, it’s free for active Edge members.