
What a time it’s been for Fluence Energy. In the past six months alone, the company’s stock price has increased by a massive 398%, reaching $20.38 per share. This was partly due to its solid quarterly results, and the run-up might have investors contemplating their next move.
Is there a buying opportunity in Fluence Energy, or does it present a risk to your portfolio? Check out our in-depth research report to see what our analysts have to say, it’s free for active Edge members.
Why Is Fluence Energy Not Exciting?
We’re happy investors have made money, but we're cautious about Fluence Energy. Here are three reasons you should be careful with FLNC and a stock we'd rather own.
1. Low Gross Margin Reveals Weak Structural Profitability
All else equal, we prefer higher gross margins because they usually indicate that a company sells more differentiated products and commands stronger pricing power.
Fluence Energy has bad unit economics for an industrials business, signaling it operates in a competitive market. As you can see below, it averaged a 7.2% gross margin over the last five years. Said differently, Fluence Energy had to pay a chunky $92.81 to its suppliers for every $100 in revenue. 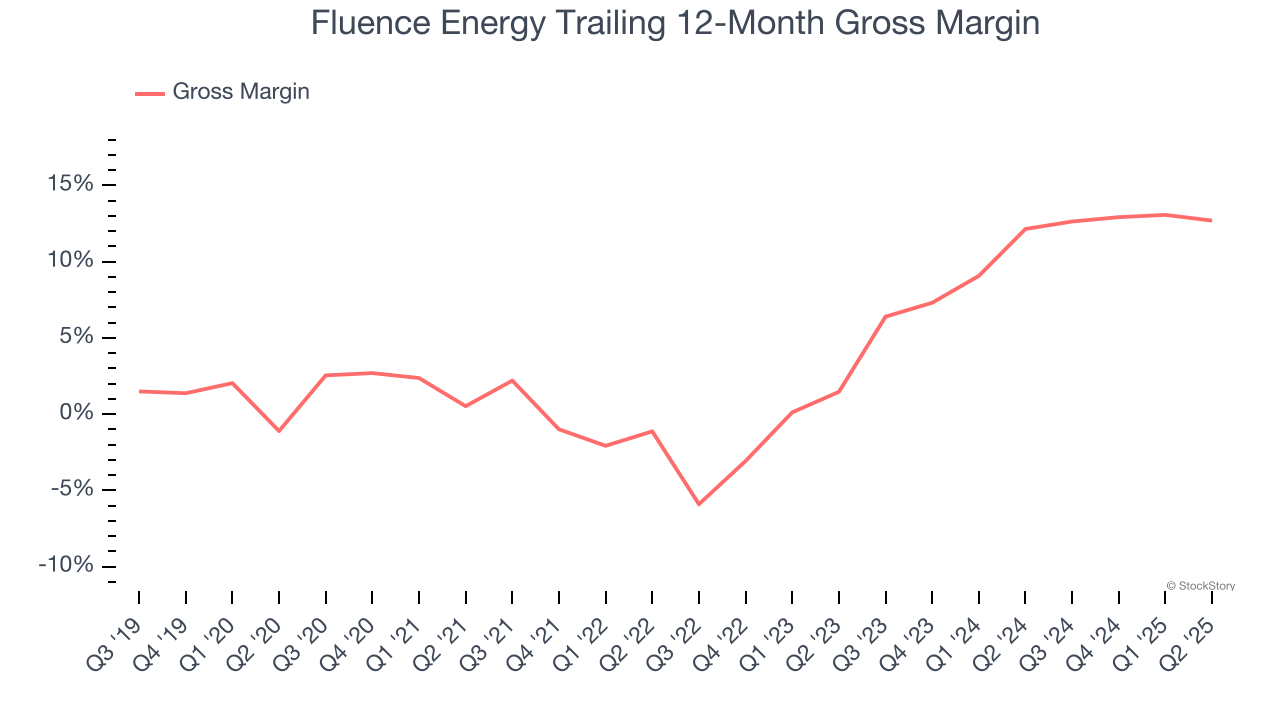
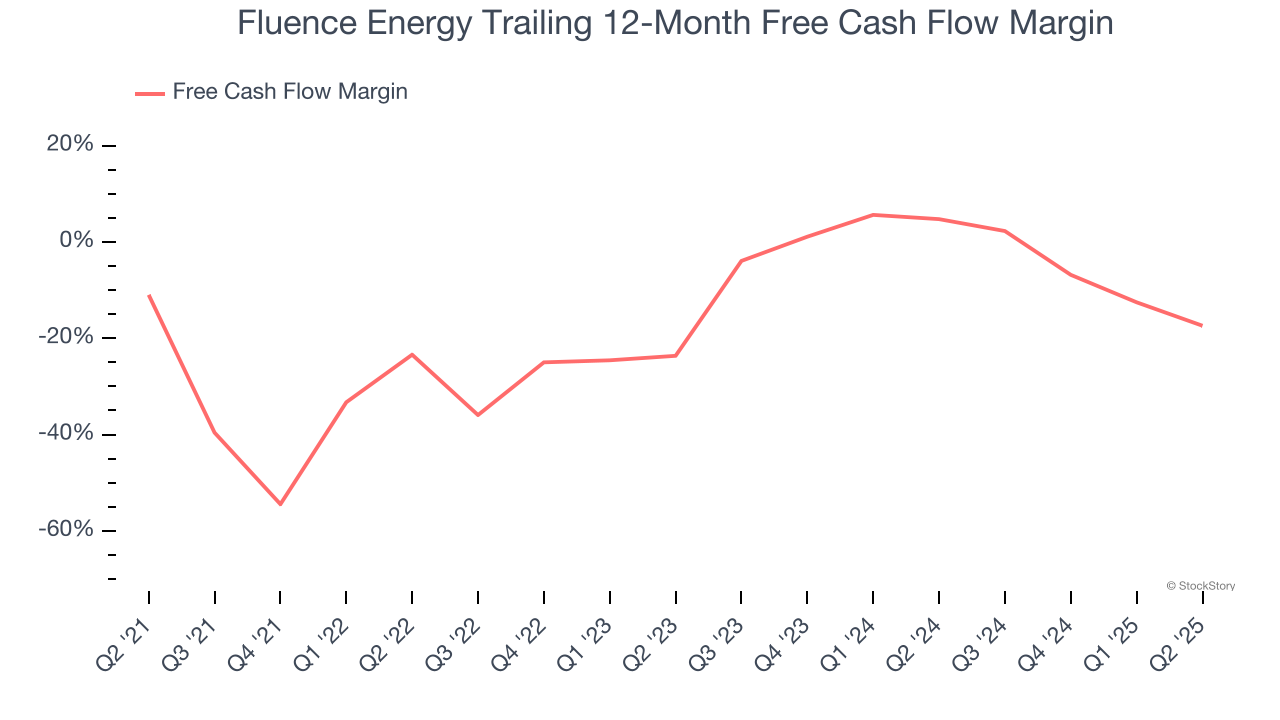
2. Free Cash Flow Margin Dropping
Free cash flow isn't a prominently featured metric in company financials and earnings releases, but we think it's telling because it accounts for all operating and capital expenses, making it tough to manipulate. Cash is king.
As you can see below, Fluence Energy’s margin dropped by 6.4 percentage points over the last five years. Almost any movement in the wrong direction is undesirable because it is already burning cash. If the trend continues, it could signal it’s becoming a more capital-intensive business. Fluence Energy’s free cash flow margin for the trailing 12 months was negative 17.4%.
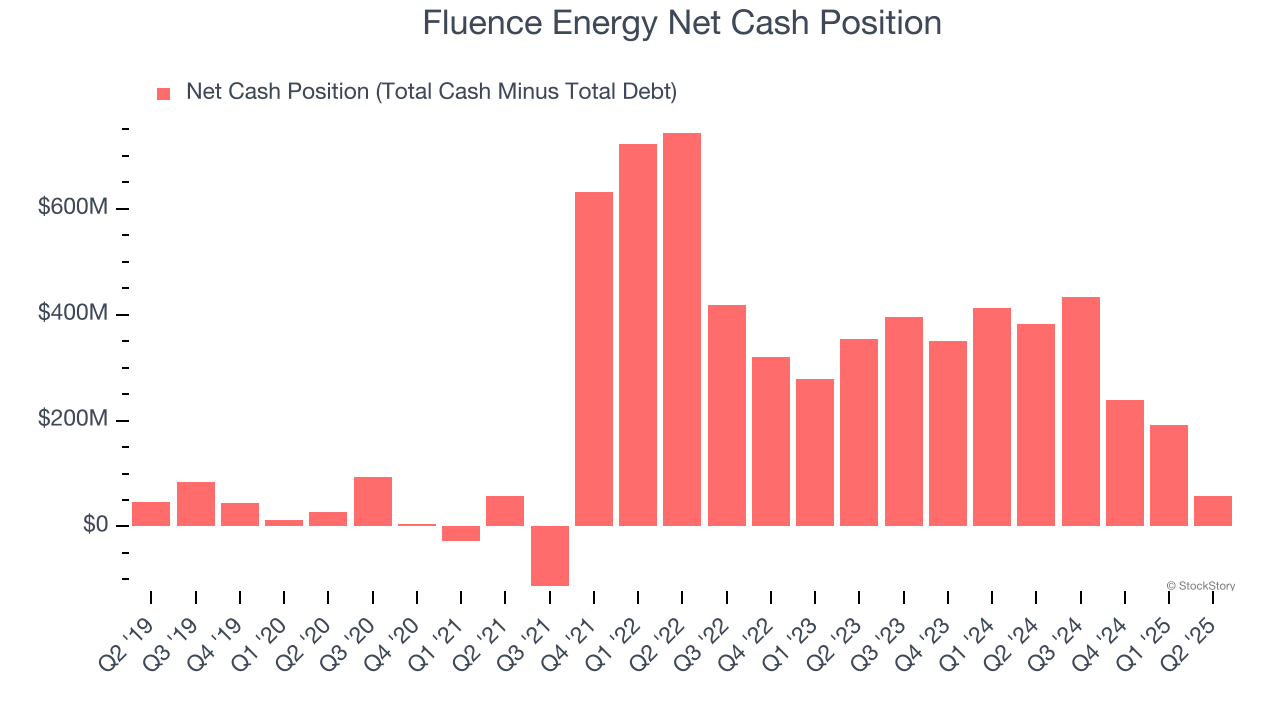
3. Short Cash Runway Exposes Shareholders to Potential Dilution
As long-term investors, the risk we care about most is the permanent loss of capital, which can happen when a company goes bankrupt or raises money from a disadvantaged position. This is separate from short-term stock price volatility, something we are much less bothered by.
Fluence Energy burned through $426.3 million of cash over the last year. With $459.9 million of cash on its balance sheet, the company has around 13 months of runway left (assuming its $402.8 million of debt isn’t due right away).
Unless the Fluence Energy’s fundamentals change quickly, it might find itself in a position where it must raise capital from investors to continue operating. Whether that would be favorable is unclear because dilution is a headwind for shareholder returns.
We remain cautious of Fluence Energy until it generates consistent free cash flow or any of its announced financing plans materialize on its balance sheet.
Final Judgment
Fluence Energy isn’t a terrible business, but it doesn’t pass our quality test. After the recent surge, the stock trades at 73.2× forward EV-to-EBITDA (or $20.38 per share). Beauty is in the eye of the beholder, but we don’t really see a big opportunity at the moment. We're fairly confident there are better investments elsewhere. We’d recommend looking at our favorite semiconductor picks and shovels play.
Stocks We Would Buy Instead of Fluence Energy
Donald Trump’s April 2025 "Liberation Day" tariffs sent markets into a tailspin, but stocks have since rebounded strongly, proving that knee-jerk reactions often create the best buying opportunities.
The smart money is already positioning for the next leg up. Don’t miss out on the recovery - check out our Top 5 Growth Stocks for this month. This is a curated list of our High Quality stocks that have generated a market-beating return of 183% over the last five years (as of March 31st 2025).
Stocks that made our list in 2020 include now familiar names such as Nvidia (+1,545% between March 2020 and March 2025) as well as under-the-radar businesses like the once-small-cap company Comfort Systems (+782% five-year return). Find your next big winner with StockStory today.
StockStory is growing and hiring equity analyst and marketing roles. Are you a 0 to 1 builder passionate about the markets and AI? See the open roles here.


