
Pharmaceutical company Amneal Pharmaceuticals (NASDAQ: AMRX) reported Q3 CY2025 results beating Wall Street’s revenue expectations, with sales up 11.7% year on year to $784.5 million. The company’s full-year revenue guidance of $3.05 billion at the midpoint came in 1.3% above analysts’ estimates. Its non-GAAP profit of $0.17 per share was 22.9% above analysts’ consensus estimates.
Is now the time to buy Amneal? Find out by accessing our full research report, it’s free for active Edge members.
Amneal (AMRX) Q3 CY2025 Highlights:
- Revenue: $784.5 million vs analyst estimates of $768.2 million (11.7% year-on-year growth, 2.1% beat)
- Adjusted EPS: $0.17 vs analyst estimates of $0.14 (22.9% beat)
- Adjusted EBITDA: $159.6 million vs analyst estimates of $160.1 million (20.3% margin, in line)
- The company reconfirmed its revenue guidance for the full year of $3.05 billion at the midpoint
- Management raised its full-year Adjusted EPS guidance to $0.78 at the midpoint, a 6.9% increase
- EBITDA guidance for the full year is $680 million at the midpoint, in line with analyst expectations
- Operating Margin: 9%, down from 12.6% in the same quarter last year
- Free Cash Flow Margin: 13.5%, down from 17.8% in the same quarter last year
- Market Capitalization: $3.28 billion
Company Overview
Founded in 2002 and growing into one of America's largest generic drug producers, Amneal Pharmaceuticals (NASDAQ: AMRX) develops, manufactures, and distributes generic medicines, specialty branded drugs, biosimilars, and injectable products for the U.S. healthcare market.
Revenue Growth
Examining a company’s long-term performance can provide clues about its quality. Even a bad business can shine for one or two quarters, but a top-tier one grows for years. Thankfully, Amneal’s 9.3% annualized revenue growth over the last five years was decent. Its growth was slightly above the average healthcare company and shows its offerings resonate with customers.
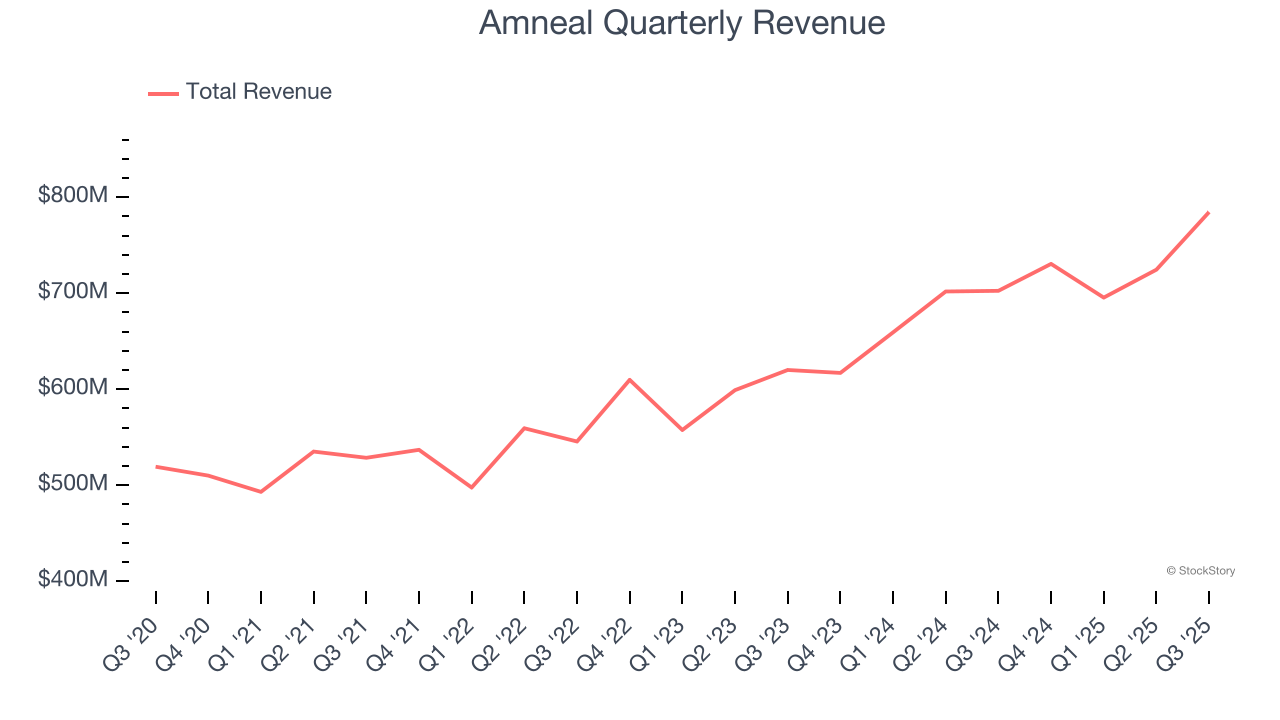
Long-term growth is the most important, but within healthcare, a half-decade historical view may miss new innovations or demand cycles. Amneal’s annualized revenue growth of 10.9% over the last two years is above its five-year trend, suggesting some bright spots. 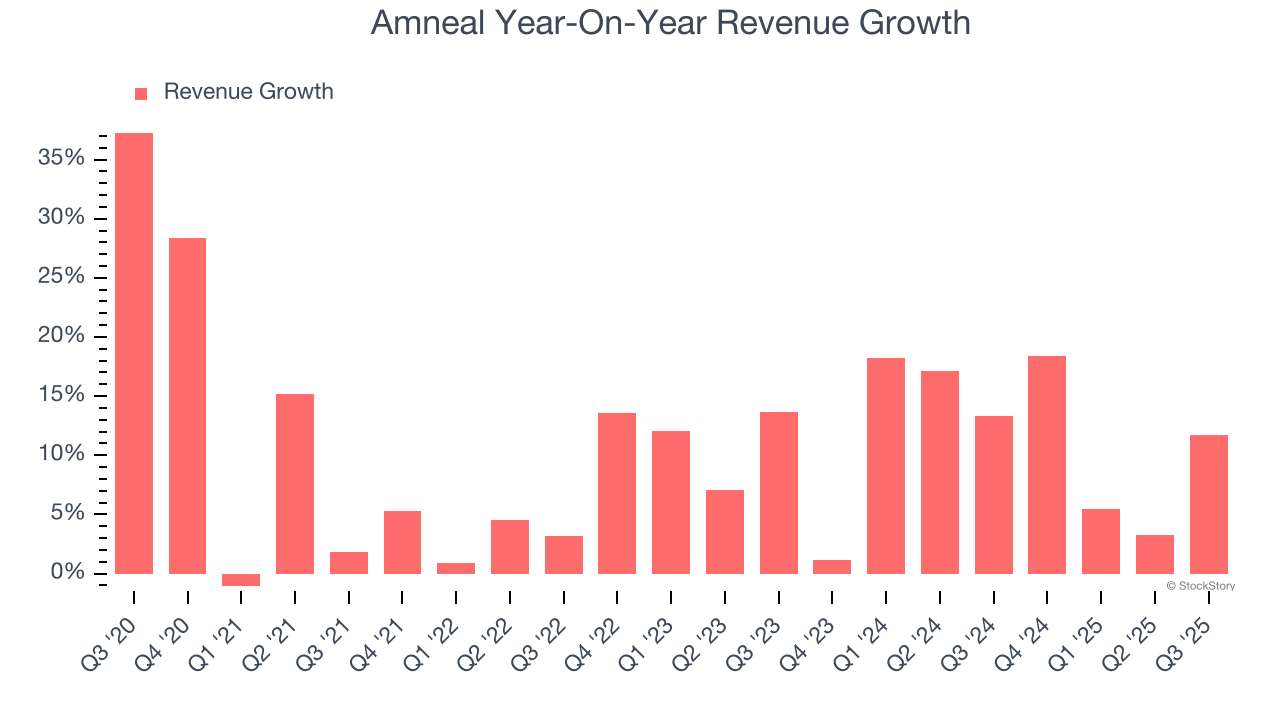
This quarter, Amneal reported year-on-year revenue growth of 11.7%, and its $784.5 million of revenue exceeded Wall Street’s estimates by 2.1%.
Looking ahead, sell-side analysts expect revenue to grow 6.3% over the next 12 months, a deceleration versus the last two years. Despite the slowdown, this projection is above average for the sector and suggests the market sees some success for its newer products and services.
Today’s young investors won’t have read the timeless lessons in Gorilla Game: Picking Winners In High Technology because it was written more than 20 years ago when Microsoft and Apple were first establishing their supremacy. But if we apply the same principles, then enterprise software stocks leveraging their own generative AI capabilities may well be the Gorillas of the future. So, in that spirit, we are excited to present our Special Free Report on a profitable, fast-growing enterprise software stock that is already riding the automation wave and looking to catch the generative AI next.
Operating Margin
Amneal was profitable over the last five years but held back by its large cost base. Its average operating margin of 6.7% was weak for a healthcare business.
On the plus side, Amneal’s operating margin rose by 4.4 percentage points over the last five years, as its sales growth gave it operating leverage. Zooming in on its more recent performance, we can see the company’s trajectory is intact as its margin has also increased by 2.7 percentage points on a two-year basis.
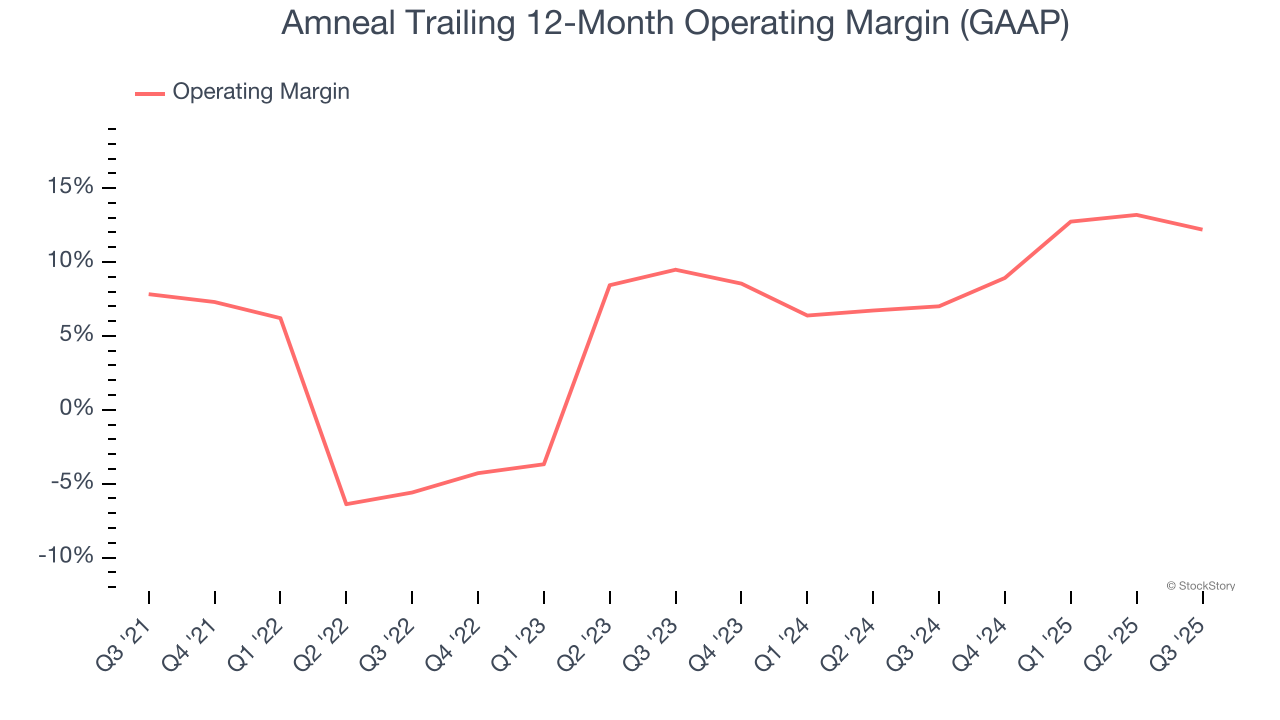
In Q3, Amneal generated an operating margin profit margin of 9%, down 3.7 percentage points year on year. This contraction shows it was less efficient because its expenses grew faster than its revenue.
Earnings Per Share
We track the long-term change in earnings per share (EPS) for the same reason as long-term revenue growth. Compared to revenue, however, EPS highlights whether a company’s growth is profitable.
Amneal’s EPS grew at a decent 5.6% compounded annual growth rate over the last five years. Despite its operating margin improvement during that time, this performance was lower than its 9.3% annualized revenue growth, telling us that non-fundamental factors such as interest and taxes affected its ultimate earnings.
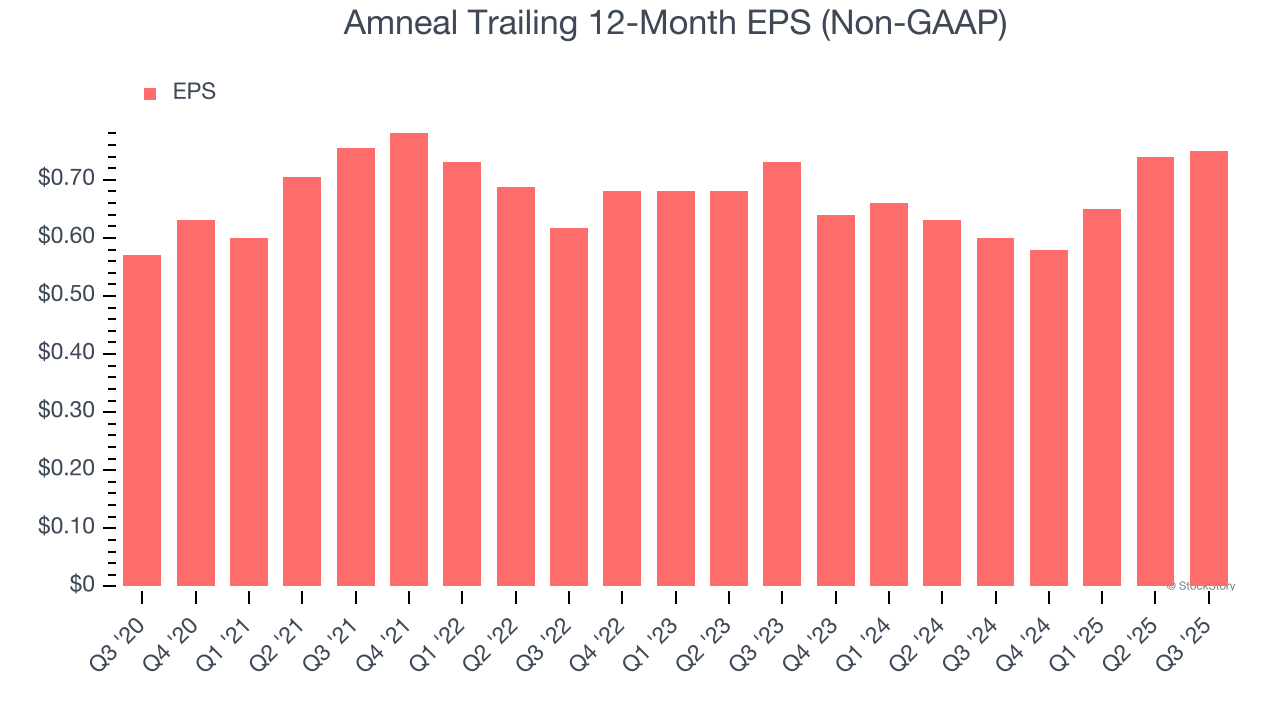
We can take a deeper look into Amneal’s earnings quality to better understand the drivers of its performance. A five-year view shows Amneal has diluted its shareholders, growing its share count by 120%. This dilution overshadowed its increased operational efficiency and has led to lower per share earnings. Taxes and interest expenses can also affect EPS but don’t tell us as much about a company’s fundamentals. 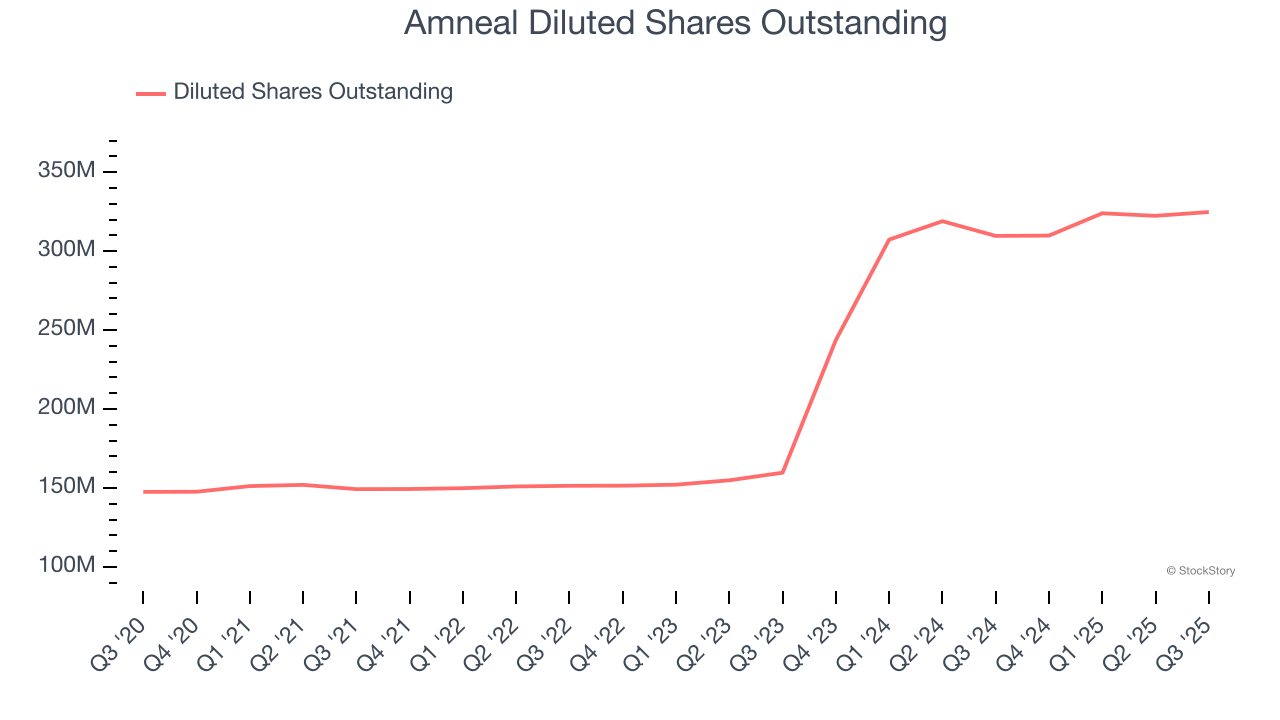
In Q3, Amneal reported adjusted EPS of $0.17, up from $0.16 in the same quarter last year. This print easily cleared analysts’ estimates, and shareholders should be content with the results. Over the next 12 months, Wall Street expects Amneal’s full-year EPS of $0.75 to grow 9.1%.
Key Takeaways from Amneal’s Q3 Results
It was good to see Amneal beat analysts’ EPS expectations this quarter. We were also glad its full-year revenue guidance slightly exceeded Wall Street’s estimates. Overall, we think this was a solid quarter with some key areas of upside. The stock traded up 6.7% to $11.13 immediately after reporting.
Indeed, Amneal had a rock-solid quarterly earnings result, but is this stock a good investment here? The latest quarter does matter, but not nearly as much as longer-term fundamentals and valuation, when deciding if the stock is a buy. We cover that in our actionable full research report which you can read here, it’s free for active Edge members.