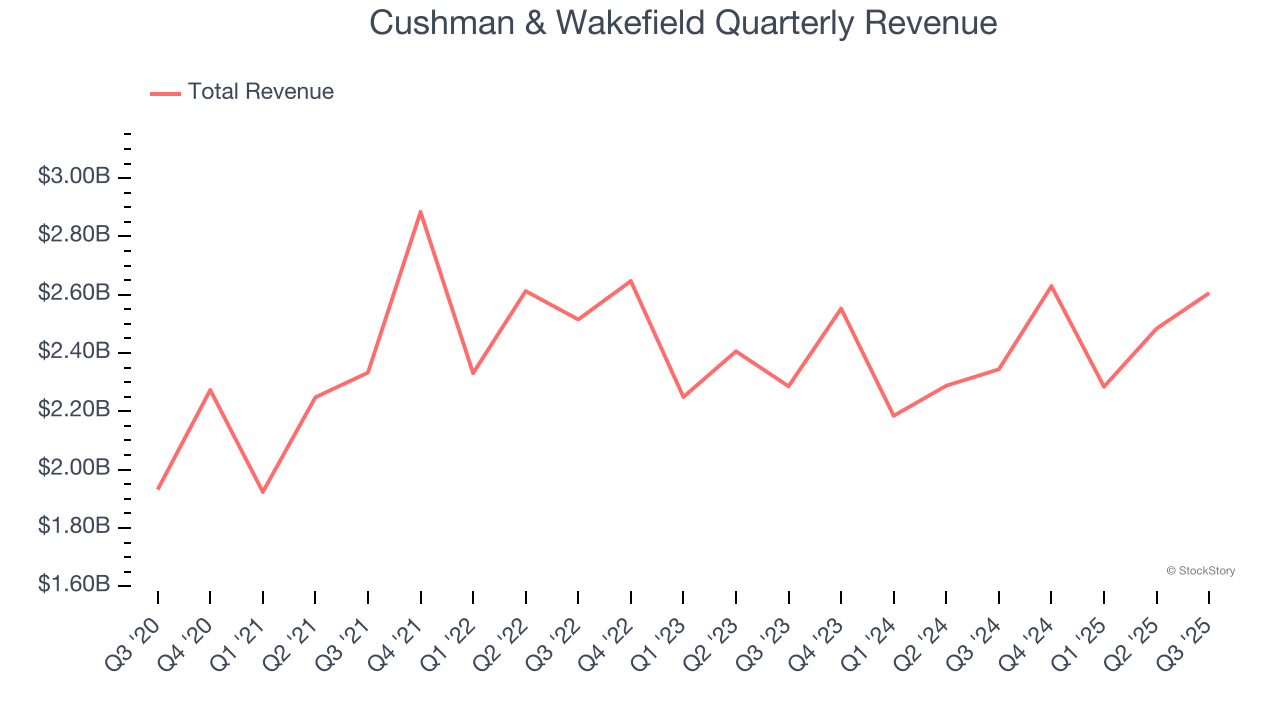
Real estate services firm Cushman & Wakefield (NYSE: CWK) announced better-than-expected revenue in Q3 CY2025, with sales up 11.2% year on year to $2.61 billion. Its non-GAAP profit of $0.29 per share was 4.3% above analysts’ consensus estimates.
Is now the time to buy Cushman & Wakefield? Find out by accessing our full research report, it’s free for active Edge members.
Cushman & Wakefield (CWK) Q3 CY2025 Highlights:
- Revenue: $2.61 billion vs analyst estimates of $2.42 billion (11.2% year-on-year growth, 7.9% beat)
- Adjusted EPS: $0.29 vs analyst estimates of $0.28 (4.3% beat)
- Adjusted EBITDA: $159.6 million vs analyst estimates of $156.1 million (6.1% margin, 2.2% beat)
- Operating Margin: 4.1%, in line with the same quarter last year
- Free Cash Flow Margin: 8.6%, similar to the same quarter last year
- Market Capitalization: $3.83 billion
Company Overview
With expertise in the commercial real estate sector, Cushman & Wakefield (NYSE: CWK) is a global Chicago-based real estate firm offering a comprehensive range of services to clients.
Revenue Growth
A company’s long-term performance is an indicator of its overall quality. Any business can put up a good quarter or two, but many enduring ones grow for years. Over the last five years, Cushman & Wakefield grew its sales at a sluggish 4.1% compounded annual growth rate. This was below our standard for the consumer discretionary sector and is a tough starting point for our analysis.
We at StockStory place the most emphasis on long-term growth, but within consumer discretionary, a stretched historical view may miss a company riding a successful new product or trend. Cushman & Wakefield’s recent performance shows its demand has slowed as its annualized revenue growth of 2.1% over the last two years was below its five-year trend. 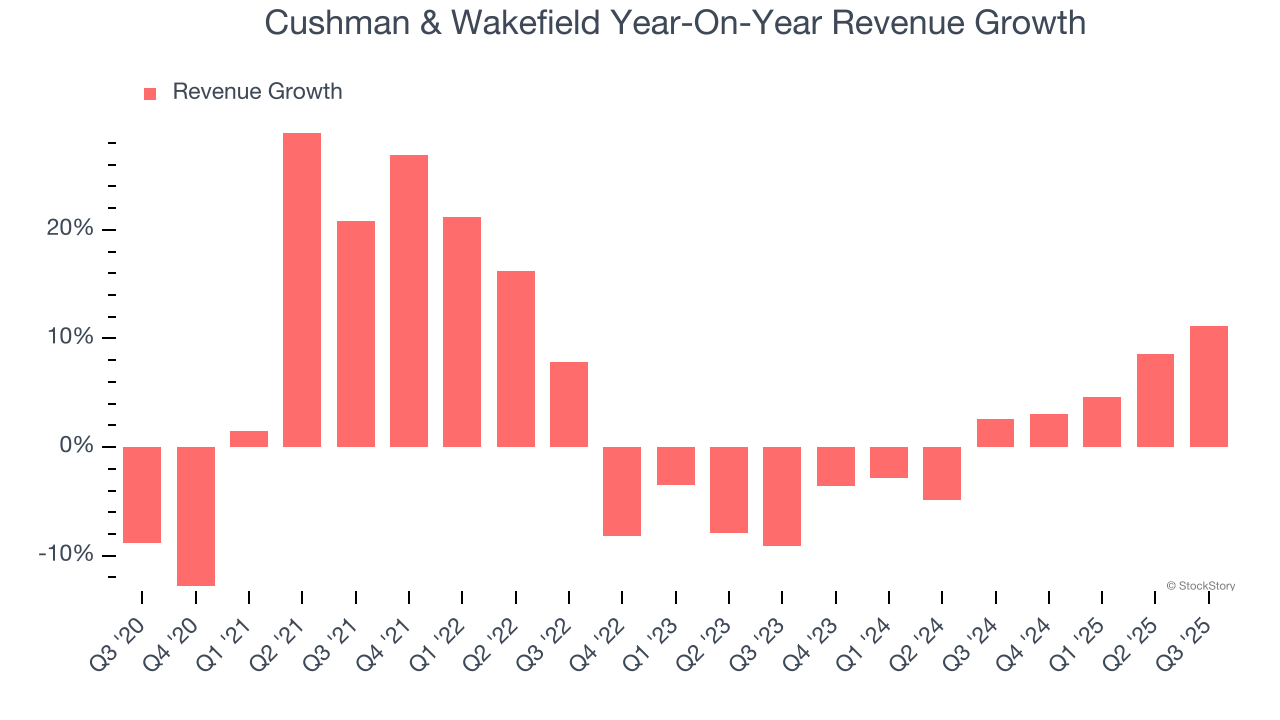
We can dig further into the company’s revenue dynamics by analyzing its three most important segments: Management, Leasing, and Capital Markets, which are 24.2%, 16.8%, and 6.2% of revenue. Over the last two years, Cushman & Wakefield’s Management revenue (property management) averaged 4.1% year-on-year declines, but its Leasing (sourcing tenants) and Capital Markets (financial advisory) revenues averaged 4.6% and 2.1% growth. 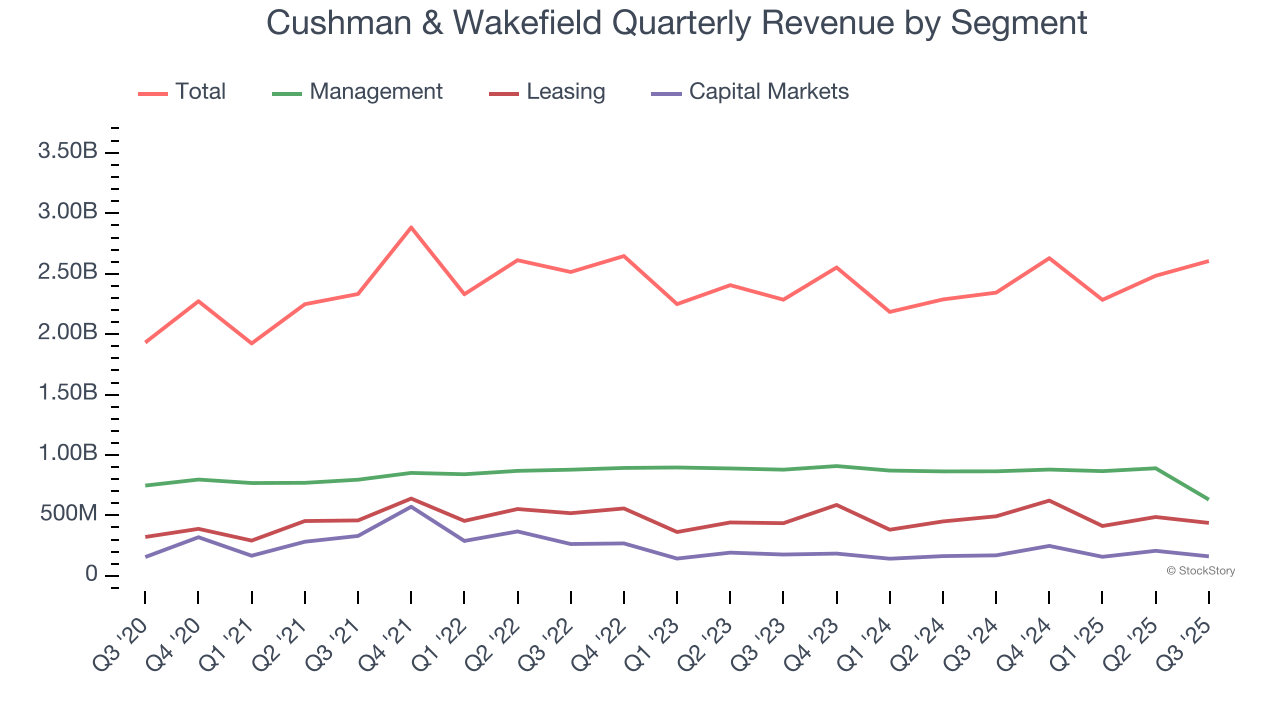
This quarter, Cushman & Wakefield reported year-on-year revenue growth of 11.2%, and its $2.61 billion of revenue exceeded Wall Street’s estimates by 7.9%.
Looking ahead, sell-side analysts expect revenue to remain flat over the next 12 months, a slight deceleration versus the last two years. This projection doesn't excite us and indicates its products and services will face some demand challenges.
Unless you’ve been living under a rock, it should be obvious by now that generative AI is going to have a huge impact on how large corporations do business. While Nvidia and AMD are trading close to all-time highs, we prefer a lesser-known (but still profitable) stock benefiting from the rise of AI. Click here to access our free report one of our favorites growth stories.
Operating Margin
Cushman & Wakefield’s operating margin has been trending up over the last 12 months and averaged 3.7% over the last two years. The company’s higher efficiency is a breath of fresh air, but its suboptimal cost structure means it still sports lousy profitability for a consumer discretionary business.
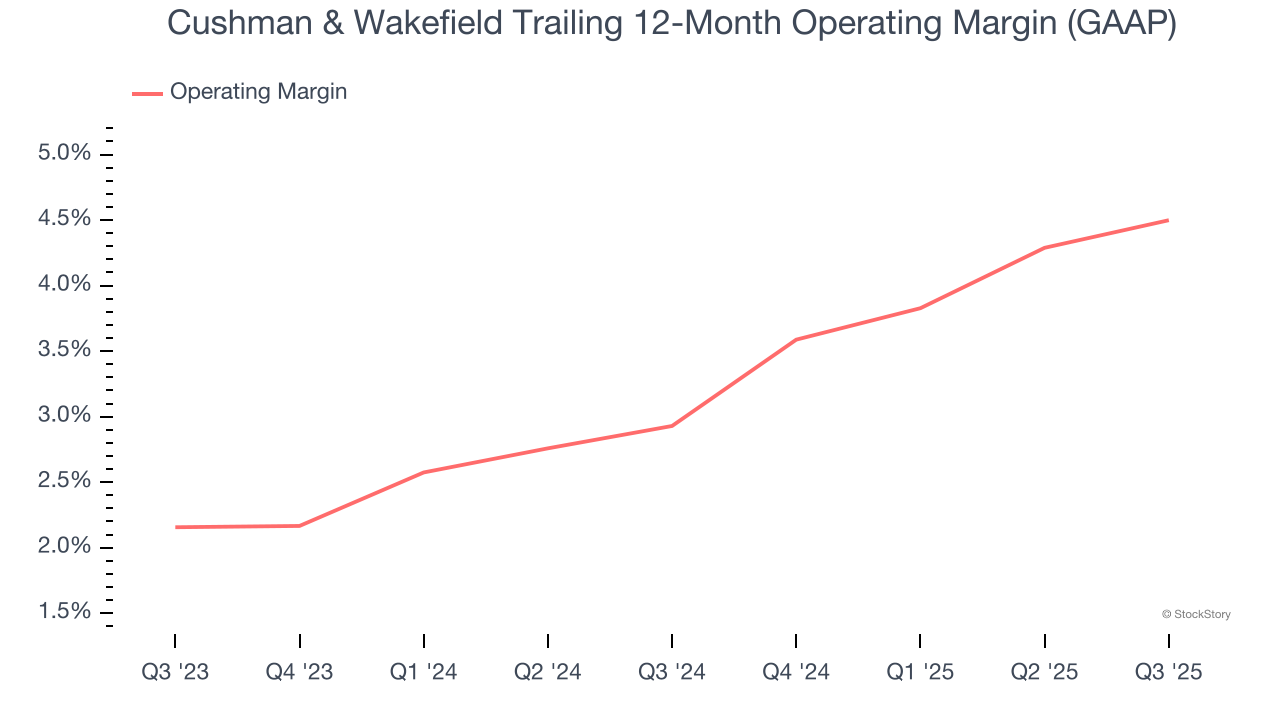
In Q3, Cushman & Wakefield generated an operating margin profit margin of 4.1%, in line with the same quarter last year. This indicates the company’s overall cost structure has been relatively stable.
Earnings Per Share
We track the long-term change in earnings per share (EPS) for the same reason as long-term revenue growth. Compared to revenue, however, EPS highlights whether a company’s growth is profitable.
Cushman & Wakefield’s flat EPS over the last five years was below its 4.1% annualized revenue growth. However, its operating margin actually improved during this time, telling us that non-fundamental factors such as interest expenses and taxes affected its ultimate earnings.
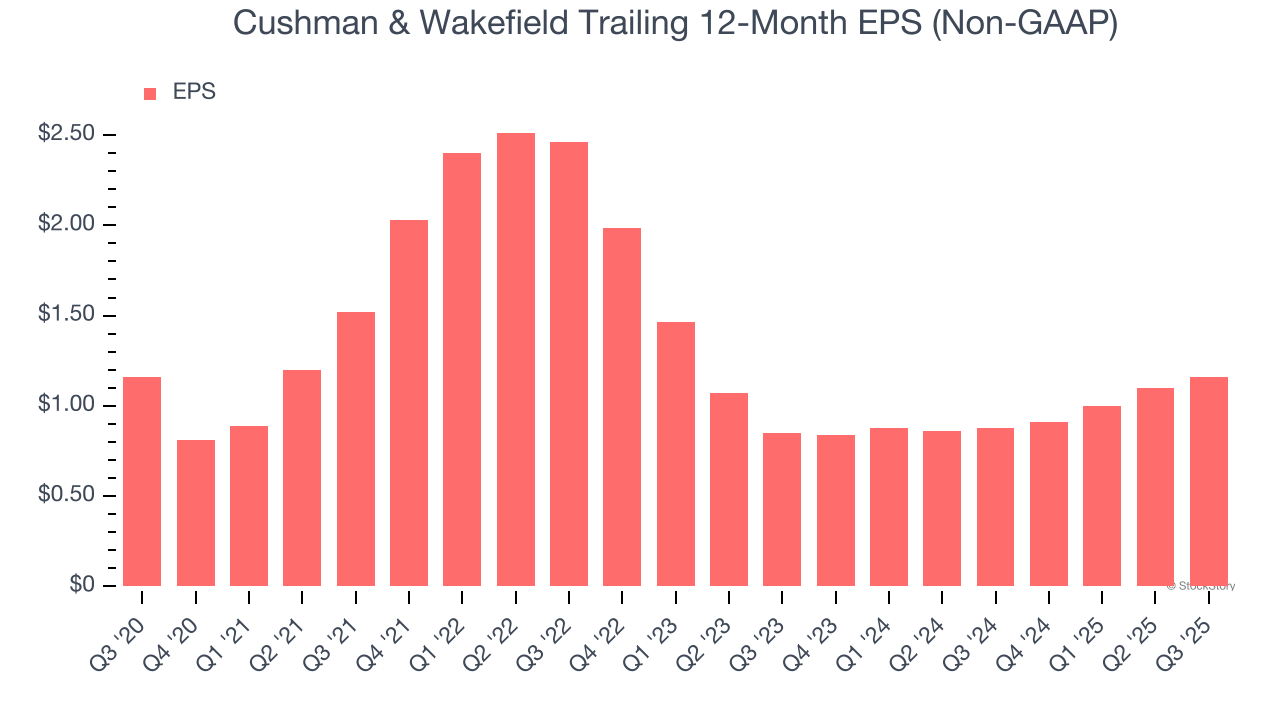
In Q3, Cushman & Wakefield reported adjusted EPS of $0.29, up from $0.23 in the same quarter last year. This print beat analysts’ estimates by 4.3%. Over the next 12 months, Wall Street expects Cushman & Wakefield’s full-year EPS of $1.16 to grow 15.9%.
Key Takeaways from Cushman & Wakefield’s Q3 Results
We enjoyed seeing Cushman & Wakefield beat analysts’ revenue expectations this quarter. We were also glad its EPS outperformed Wall Street’s estimates. Overall, we think this was a decent quarter with some key metrics above expectations. The stock traded up 1.5% to $16.80 immediately following the results.
Cushman & Wakefield put up rock-solid earnings, but one quarter doesn’t necessarily make the stock a buy. Let’s see if this is a good investment. We think that the latest quarter is only one piece of the longer-term business quality puzzle. Quality, when combined with valuation, can help determine if the stock is a buy. We cover that in our actionable full research report which you can read here, it’s free for active Edge members.