
Medical device company DexCom (NASDAQ: DXCM) announced better-than-expected revenue in Q3 CY2025, with sales up 21.6% year on year to $1.21 billion. The company expects the full year’s revenue to be around $4.64 billion, close to analysts’ estimates. Its non-GAAP profit of $0.61 per share was 7.5% above analysts’ consensus estimates.
Is now the time to buy DexCom? Find out by accessing our full research report, it’s free for active Edge members.
DexCom (DXCM) Q3 CY2025 Highlights:
- Revenue: $1.21 billion vs analyst estimates of $1.18 billion (21.6% year-on-year growth, 2.5% beat)
- Adjusted EPS: $0.61 vs analyst estimates of $0.57 (7.5% beat)
- Adjusted EBITDA: $368.4 million vs analyst estimates of $378.9 million (30.5% margin, 2.8% miss)
- The company slightly lifted its revenue guidance for the full year to $4.64 billion at the midpoint from $4.61 billion
- Operating Margin: 20.1%, up from 15.3% in the same quarter last year
- Organic Revenue rose 20% year on year vs analyst estimates of 19.6% growth (43.5 basis point beat)
- Market Capitalization: $26.74 billion
Company Overview
Founded in 1999 and receiving its first FDA approval in 2006, DexCom (NASDAQ: DXCM) develops and sells continuous glucose monitoring systems that allow people with diabetes to track their blood sugar levels without repeated finger pricks.
Revenue Growth
A company’s long-term sales performance can indicate its overall quality. Even a bad business can shine for one or two quarters, but a top-tier one grows for years. Over the last five years, DexCom grew its sales at an impressive 19.9% compounded annual growth rate. Its growth surpassed the average healthcare company and shows its offerings resonate with customers, a great starting point for our analysis.
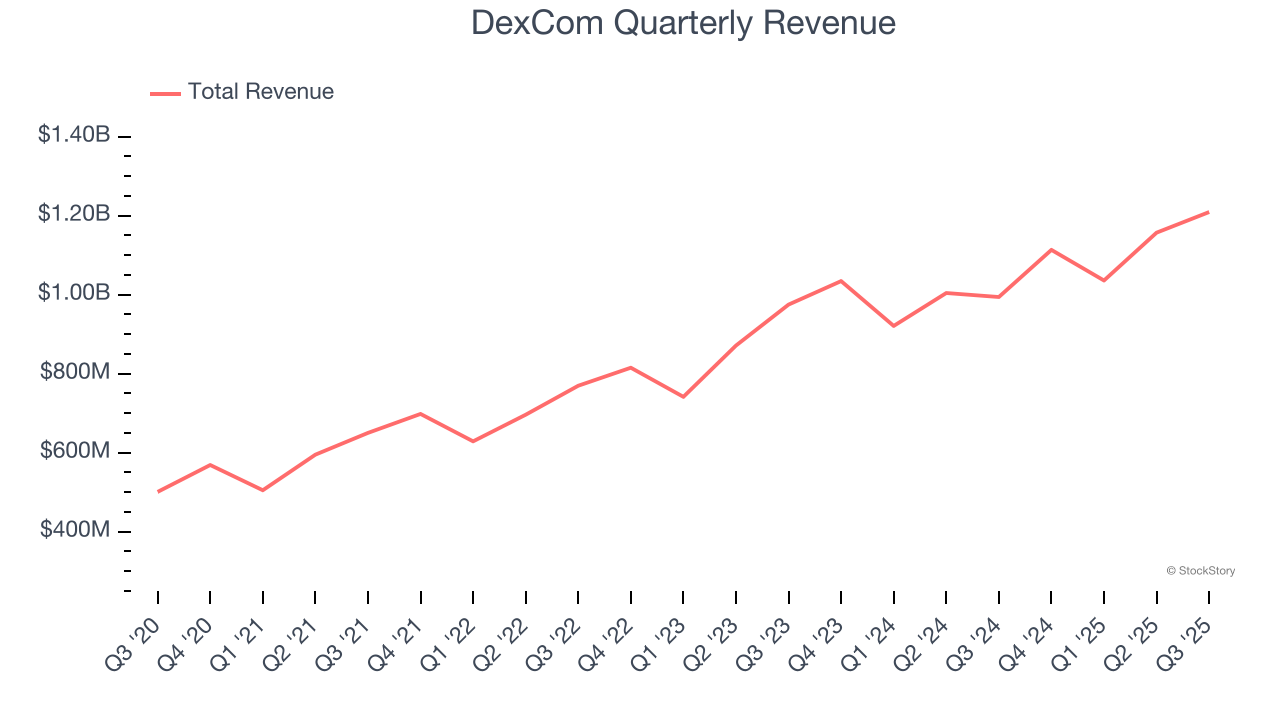
Long-term growth is the most important, but within healthcare, a half-decade historical view may miss new innovations or demand cycles. DexCom’s annualized revenue growth of 15.2% over the last two years is below its five-year trend, but we still think the results suggest healthy demand. 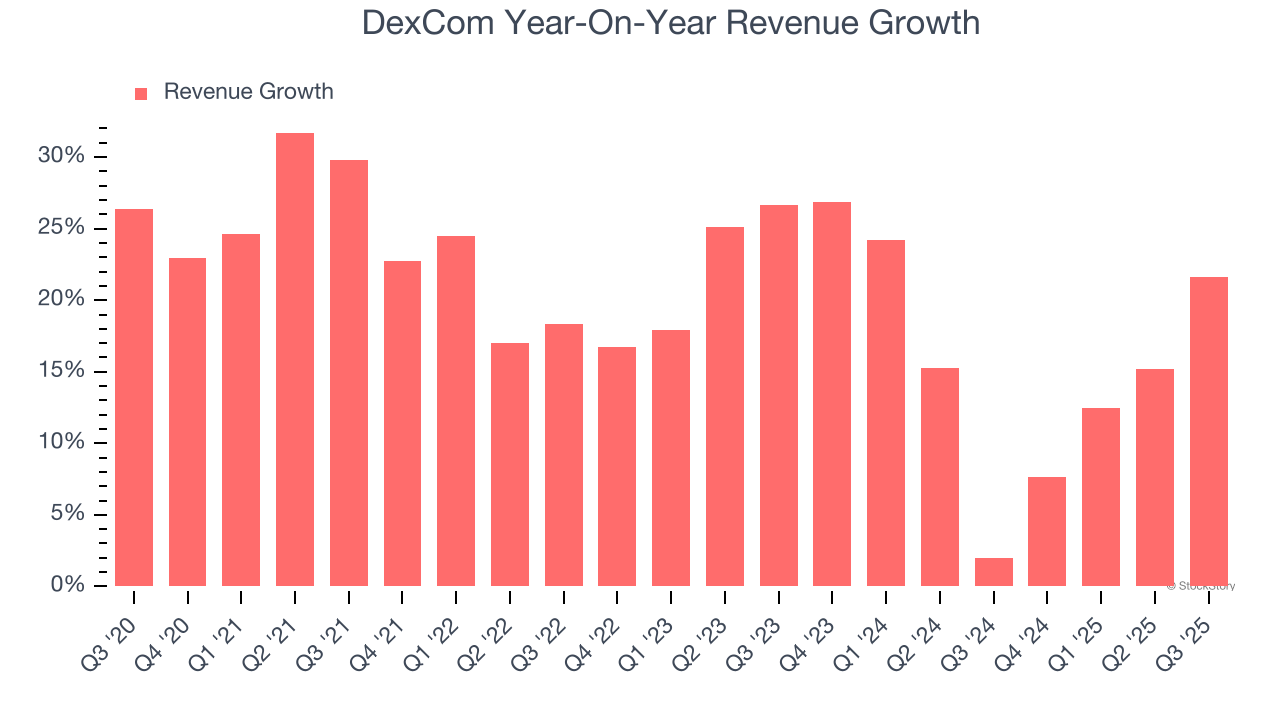
We can dig further into the company’s sales dynamics by analyzing its organic revenue, which strips out one-time events like acquisitions and currency fluctuations that don’t accurately reflect its fundamentals. Over the last two years, DexCom’s organic revenue averaged 17.1% year-on-year growth. Because this number is better than its two-year revenue growth, we can see that some mixture of divestitures and foreign exchange rates dampened its headline results. 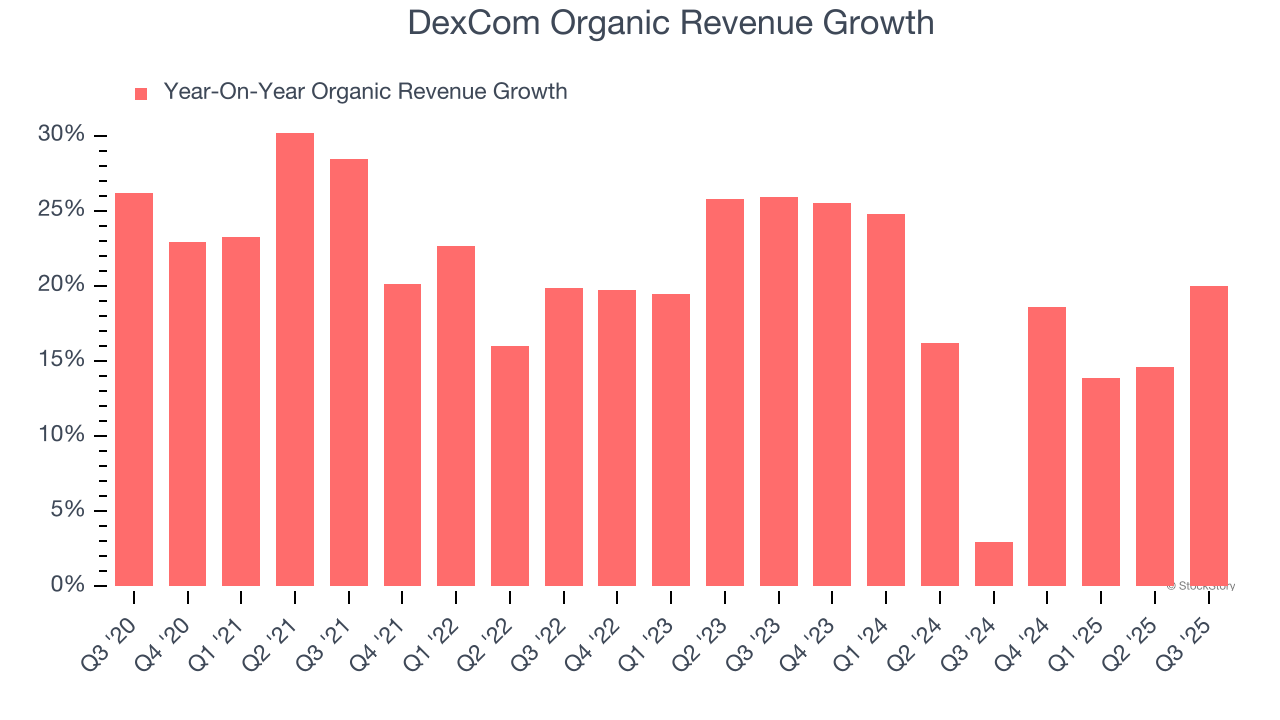
This quarter, DexCom reported robust year-on-year revenue growth of 21.6%, and its $1.21 billion of revenue topped Wall Street estimates by 2.5%.
Looking ahead, sell-side analysts expect revenue to grow 13.9% over the next 12 months, similar to its two-year rate. Despite the slowdown, this projection is commendable and suggests the market is forecasting success for its products and services.
Unless you’ve been living under a rock, it should be obvious by now that generative AI is going to have a huge impact on how large corporations do business. While Nvidia and AMD are trading close to all-time highs, we prefer a lesser-known (but still profitable) stock benefiting from the rise of AI. Click here to access our free report one of our favorites growth stories.
Operating Margin
DexCom has done a decent job managing its cost base over the last five years. The company has produced an average operating margin of 15%, higher than the broader healthcare sector.
Looking at the trend in its profitability, DexCom’s operating margin rose by 1.3 percentage points over the last five years, as its sales growth gave it operating leverage. This performance was mostly driven by its recent improvements as the company’s margin has increased by 2.3 percentage points on a two-year basis. These data points are very encouraging and show momentum is on its side.
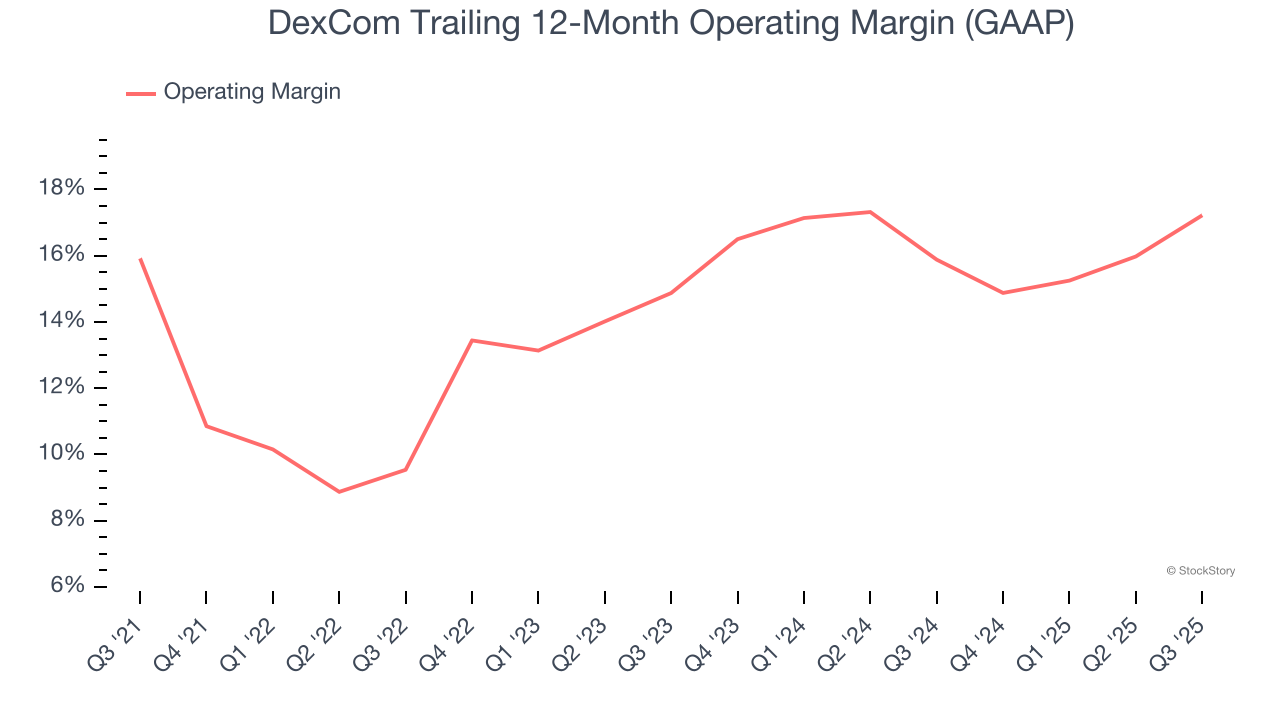
In Q3, DexCom generated an operating margin profit margin of 20.1%, up 4.8 percentage points year on year. This increase was a welcome development and shows it was more efficient.
Earnings Per Share
We track the long-term change in earnings per share (EPS) for the same reason as long-term revenue growth. Compared to revenue, however, EPS highlights whether a company’s growth is profitable.
DexCom’s EPS grew at an astounding 17.5% compounded annual growth rate over the last five years. Despite its operating margin improvement during that time, this performance was lower than its 19.9% annualized revenue growth, telling us that non-fundamental factors such as interest and taxes affected its ultimate earnings.
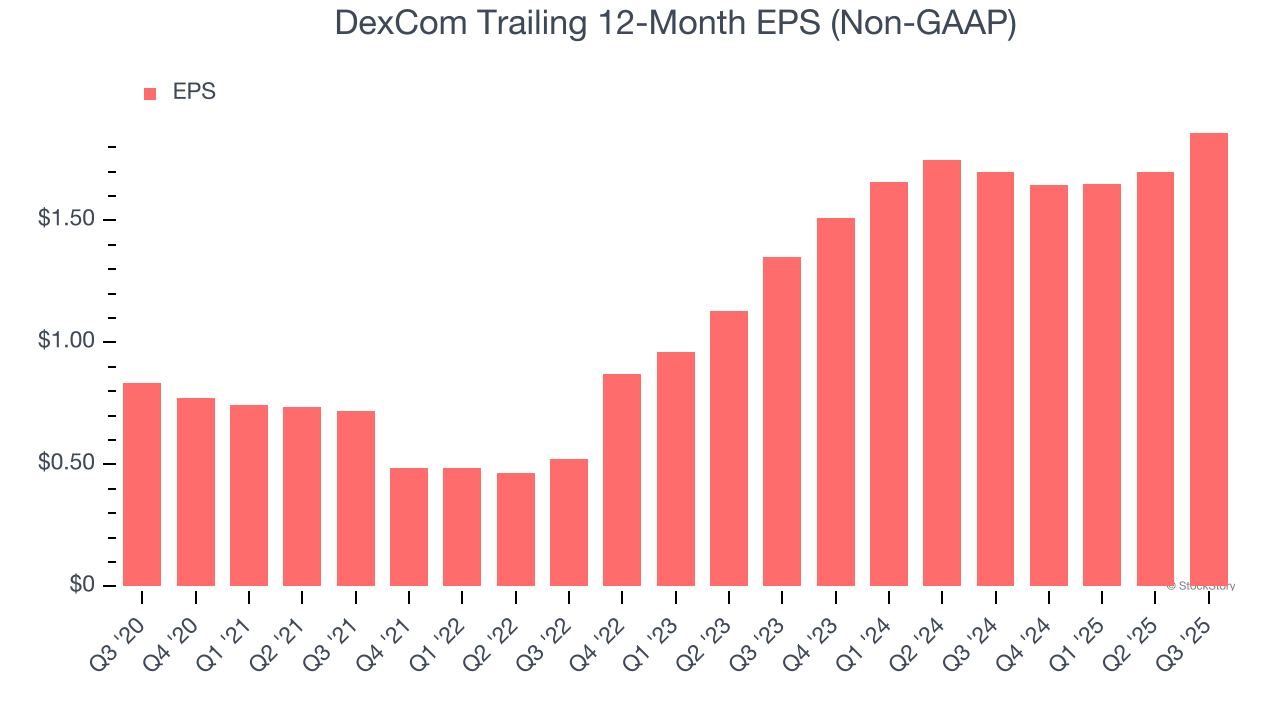
Diving into DexCom’s quality of earnings can give us a better understanding of its performance. A five-year view shows DexCom has diluted its shareholders, growing its share count by 2.4%. This dilution overshadowed its increased operational efficiency and has led to lower per share earnings. Taxes and interest expenses can also affect EPS but don’t tell us as much about a company’s fundamentals. 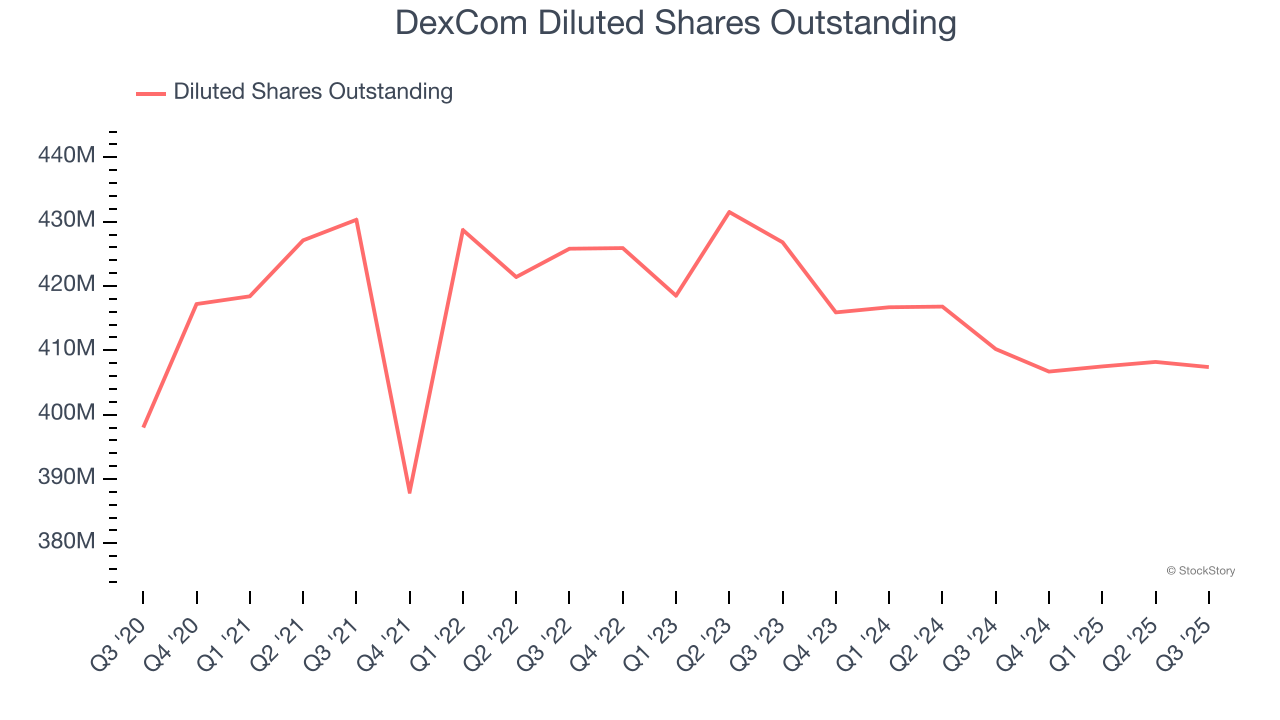
In Q3, DexCom reported adjusted EPS of $0.61, up from $0.45 in the same quarter last year. This print beat analysts’ estimates by 7.5%. Over the next 12 months, Wall Street expects DexCom’s full-year EPS of $1.86 to grow 31.6%.
Key Takeaways from DexCom’s Q3 Results
We enjoyed seeing DexCom beat analysts’ revenue expectations this quarter. We were also glad its EPS outperformed Wall Street’s estimates. Overall, this print had some key positives. The market seemed to be hoping for more, and the stock traded down 8.8% to $62.20 immediately following the results.
Is DexCom an attractive investment opportunity at the current price? We think that the latest quarter is only one piece of the longer-term business quality puzzle. Quality, when combined with valuation, can help determine if the stock is a buy. We cover that in our actionable full research report which you can read here, it’s free for active Edge members.