
Dental products company Envista Holdings (NYSE: NVST) reported Q3 CY2025 results topping the market’s revenue expectations, with sales up 11.5% year on year to $669.9 million. Its non-GAAP profit of $0.32 per share was 16% above analysts’ consensus estimates.
Is now the time to buy Envista? Find out by accessing our full research report, it’s free for active Edge members.
Envista (NVST) Q3 CY2025 Highlights:
- Revenue: $669.9 million vs analyst estimates of $640.2 million (11.5% year-on-year growth, 4.6% beat)
- Adjusted EPS: $0.32 vs analyst estimates of $0.28 (16% beat)
- Adjusted EBITDA: $97.1 million vs analyst estimates of $90.52 million (14.5% margin, 7.3% beat)
- Management raised its full-year Adjusted EPS guidance to $1.13 at the midpoint, a 2.3% increase
- Operating Margin: 8.6%, up from 3.5% in the same quarter last year
- Free Cash Flow Margin: 10.1%, similar to the same quarter last year
- Market Capitalization: $3.32 billion
Company Overview
Uniting more than 30 trusted brands including Nobel Biocare, Ormco, and DEXIS under one corporate umbrella, Envista Holdings (NYSE: NVST) is a global dental products company that provides equipment, consumables, and specialized technologies for dental professionals.
Revenue Growth
Reviewing a company’s long-term sales performance reveals insights into its quality. Any business can put up a good quarter or two, but the best consistently grow over the long haul. Unfortunately, Envista’s 5.2% annualized revenue growth over the last five years was mediocre. This was below our standard for the healthcare sector and is a tough starting point for our analysis.
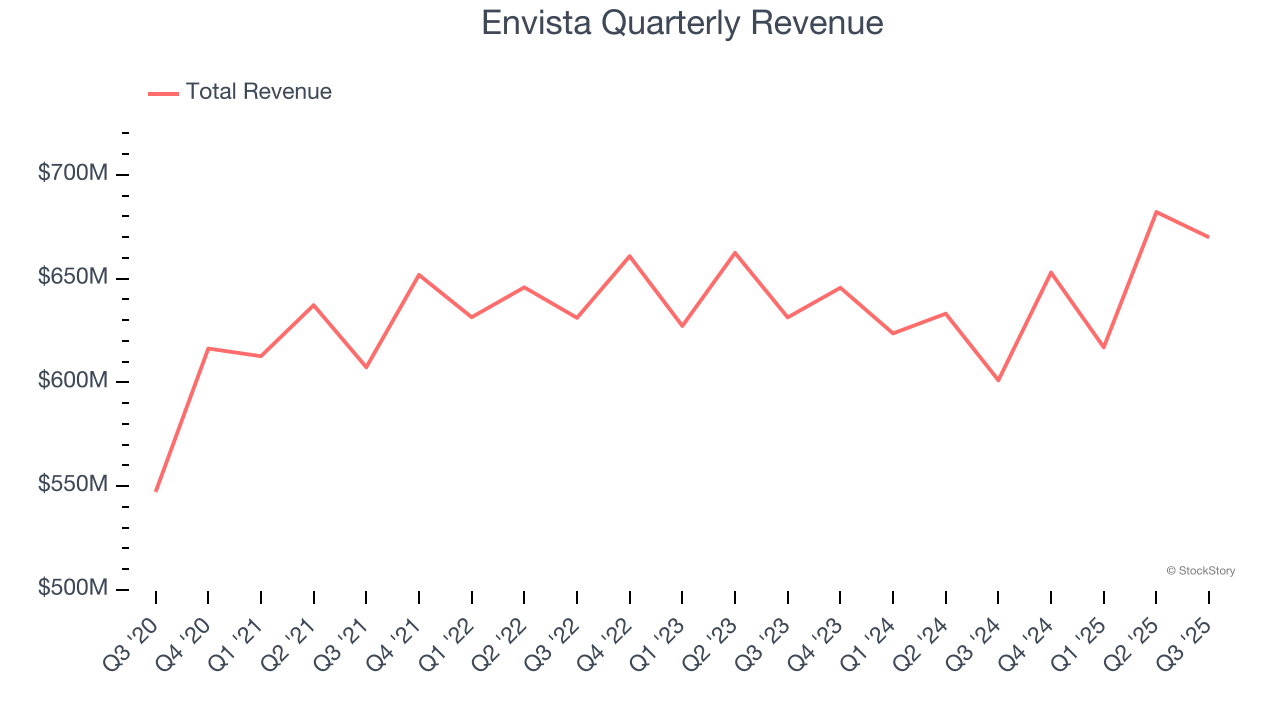
Long-term growth is the most important, but within healthcare, a half-decade historical view may miss new innovations or demand cycles. Envista’s recent performance shows its demand has slowed as its revenue was flat over the last two years. 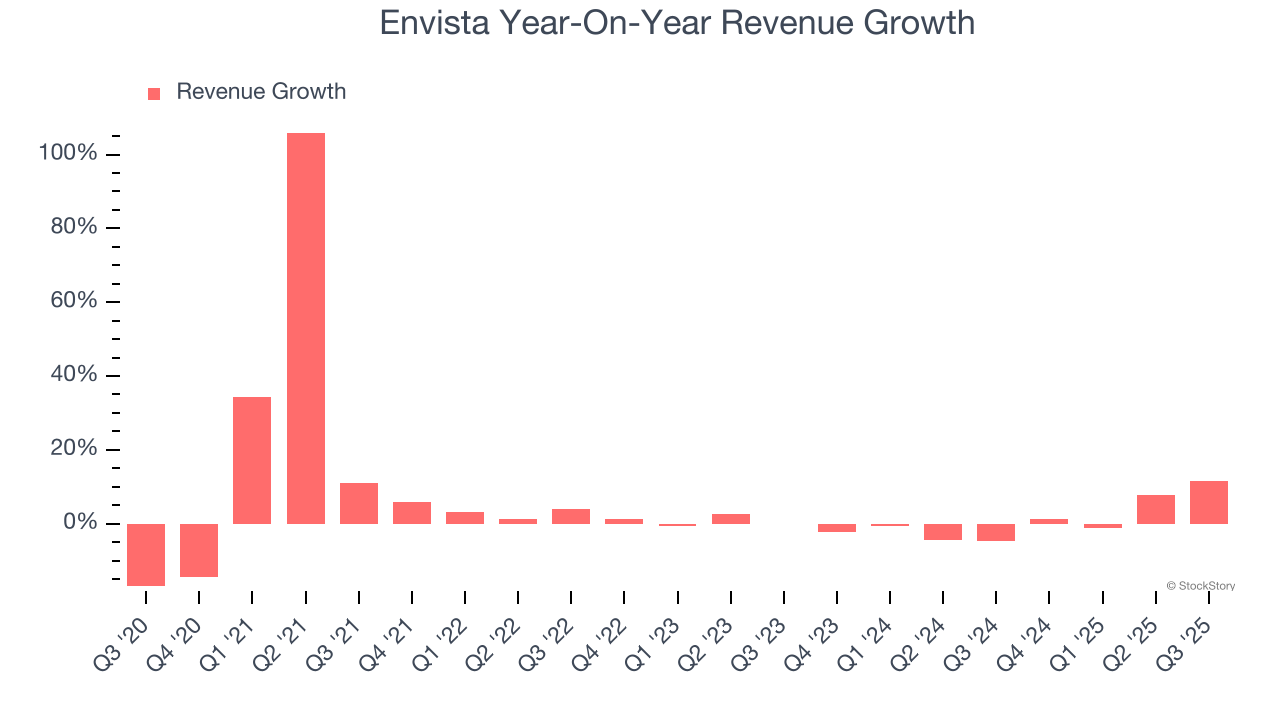
This quarter, Envista reported year-on-year revenue growth of 11.5%, and its $669.9 million of revenue exceeded Wall Street’s estimates by 4.6%.
Looking ahead, sell-side analysts expect revenue to grow 2.8% over the next 12 months. While this projection indicates its newer products and services will catalyze better top-line performance, it is still below the sector average.
Here at StockStory, we certainly understand the potential of thematic investing. Diverse winners from Microsoft (MSFT) to Alphabet (GOOG), Coca-Cola (KO) to Monster Beverage (MNST) could all have been identified as promising growth stories with a megatrend driving the growth. So, in that spirit, we’ve identified a relatively under-the-radar profitable growth stock benefiting from the rise of AI, available to you FREE via this link.
Operating Margin
Operating margin is a key measure of profitability. Think of it as net income - the bottom line - excluding the impact of taxes and interest on debt, which are less connected to business fundamentals.
Although Envista was profitable this quarter from an operational perspective, it’s generally struggled over a longer time period. Its expensive cost structure has contributed to an average operating margin of negative 1.3% over the last five years. Unprofitable healthcare companies require extra attention because they could get caught swimming naked when the tide goes out. It’s hard to trust that the business can endure a full cycle.
Analyzing the trend in its profitability, Envista’s operating margin decreased by 6.3 percentage points over the last five years. The company’s two-year trajectory also shows it failed to get its profitability back to the peak as its margin fell by 5.3 percentage points. This performance was poor no matter how you look at it - it shows its expenses were rising and it couldn’t pass those costs onto its customers.
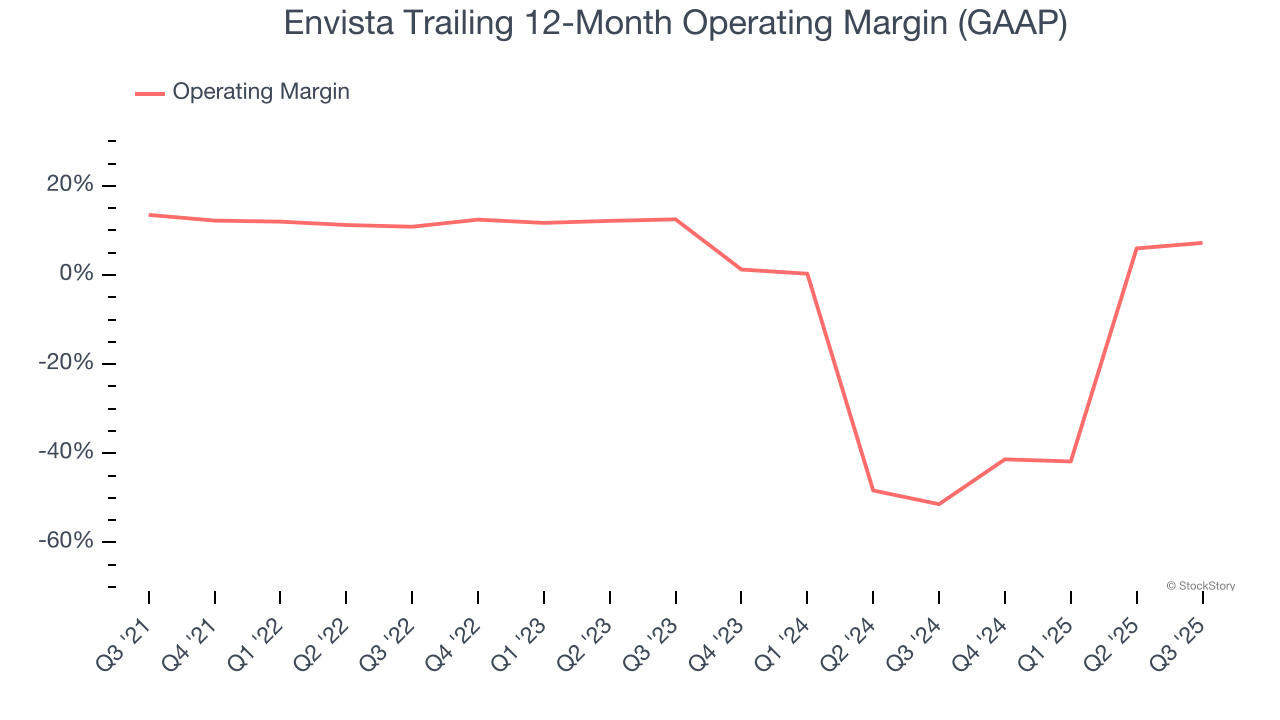
In Q3, Envista generated an operating margin profit margin of 8.6%, up 5.1 percentage points year on year. This increase was a welcome development and shows it was more efficient.
Earnings Per Share
We track the long-term change in earnings per share (EPS) for the same reason as long-term revenue growth. Compared to revenue, however, EPS highlights whether a company’s growth is profitable.
Envista’s unimpressive 4.1% annual EPS growth over the last five years aligns with its revenue performance. This tells us it maintained its per-share profitability as it expanded.
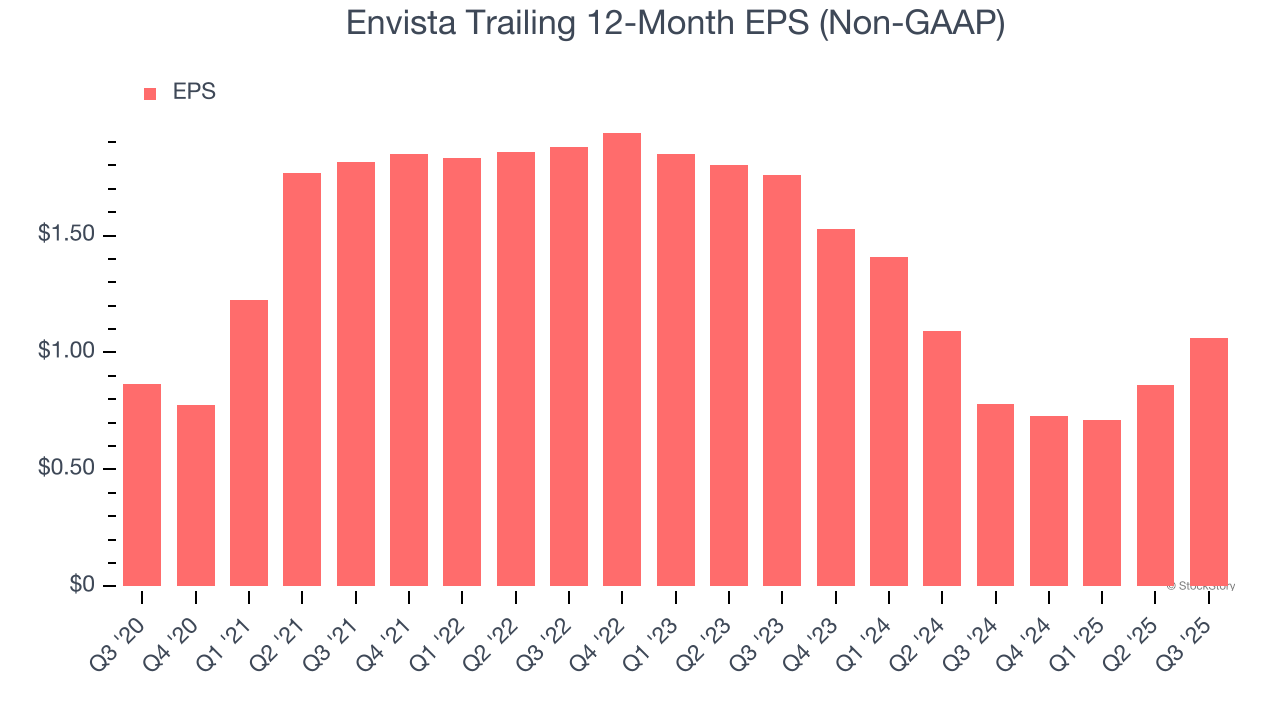
In Q3, Envista reported adjusted EPS of $0.32, up from $0.12 in the same quarter last year. This print easily cleared analysts’ estimates, and shareholders should be content with the results. Over the next 12 months, Wall Street expects Envista’s full-year EPS of $1.06 to grow 12.6%.
Key Takeaways from Envista’s Q3 Results
We enjoyed seeing Envista beat analysts’ revenue expectations this quarter. We were also glad its EPS outperformed Wall Street’s estimates. Zooming out, we think this was a solid print. The stock traded up 1.1% to $20.19 immediately after reporting.
Envista may have had a good quarter, but does that mean you should invest right now? If you’re making that decision, you should consider the bigger picture of valuation, business qualities, as well as the latest earnings. We cover that in our actionable full research report which you can read here, it’s free for active Edge members.


