
Insurance and retirement company Lincoln National (NYSE: LNC) missed Wall Street’s revenue expectations in Q3 CY2025, with sales falling 3% year on year to $4.47 billion. Its non-GAAP profit of $2.04 per share was 9.3% above analysts’ consensus estimates.
Is now the time to buy Lincoln Financial Group? Find out by accessing our full research report, it’s free for active Edge members.
Lincoln Financial Group (LNC) Q3 CY2025 Highlights:
- Net Premiums Earned: $1.35 billion vs analyst estimates of $1.67 billion (54.4% year-on-year decline, 19.2% miss)
- Revenue: $4.47 billion vs analyst estimates of $4.81 billion (3% year-on-year decline, 7.2% miss)
- Pre-tax Profit: $368 million (8.2% margin, 152% year-on-year growth)
- Adjusted EPS: $2.04 vs analyst estimates of $1.87 (9.3% beat)
- Book Value per Share: $69.66 vs analyst estimates of $69.42 (47.8% year-on-year growth, in line)
- Market Capitalization: $7.59 billion
"This quarter’s results underscore the broad-based momentum across Lincoln as we advance our strategic priorities," said Ellen Cooper, Chairman, President and CEO of Lincoln Financial.
Company Overview
Founded in 1905 by a group of Fort Wayne, Indiana businessmen who named the company after Abraham Lincoln, Lincoln National Corporation (NYSE: LNC) provides insurance, retirement plans, and wealth management products through its subsidiaries, operating under four main segments: Annuities, Life Insurance, Group Protection, and Retirement Plan Services.
Revenue Growth
Insurance companies generate revenue three ways. The first is the core insurance business itself, represented in the income statement as premiums earned. The second source is investment income from investing the “float” (premiums collected but not yet paid out as claims) in assets such as fixed-income assets and equities. The third is fees from policy administration, annuities, and other value-added services. Unfortunately, Lincoln Financial Group struggled to consistently increase demand as its $18.51 billion of revenue for the trailing 12 months was close to its revenue five years ago. This wasn’t a great result and is a sign of poor business quality.
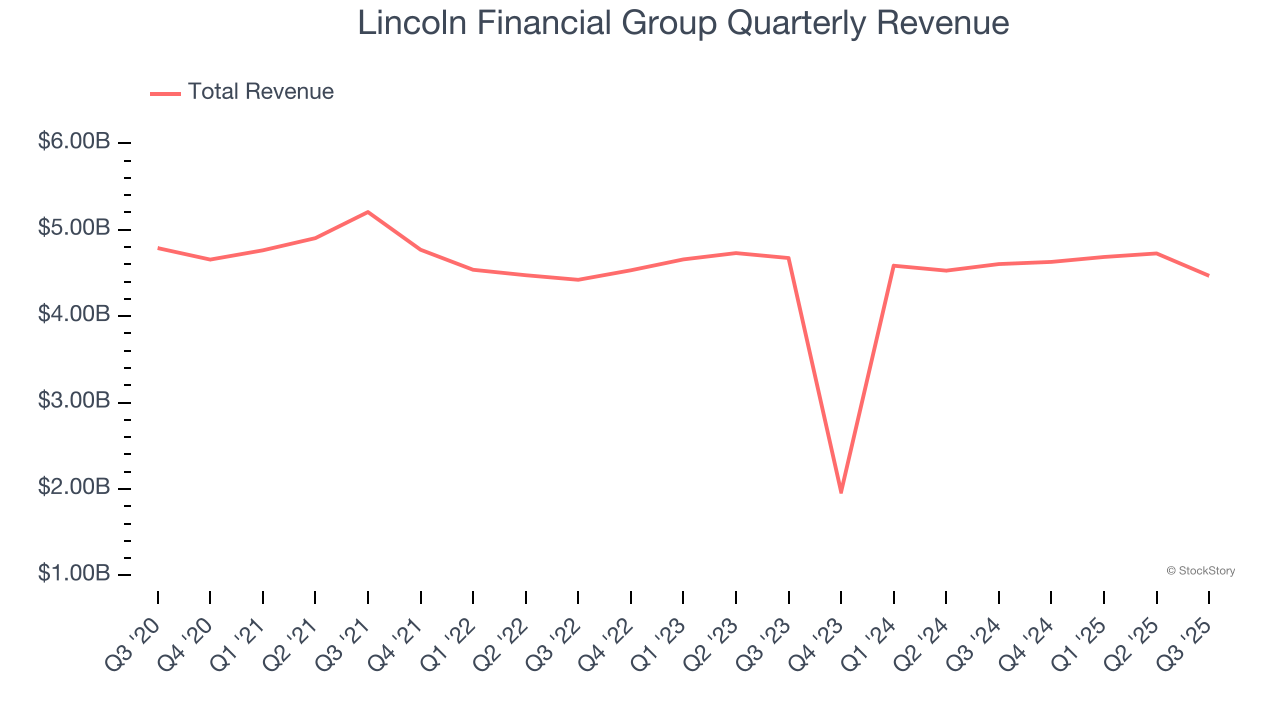
We at StockStory place the most emphasis on long-term growth, but within financials, a half-decade historical view may miss recent interest rate changes, market returns, and industry trends. Just like its five-year trend, Lincoln Financial Group’s revenue over the last two years was flat, suggesting it is in a slump. 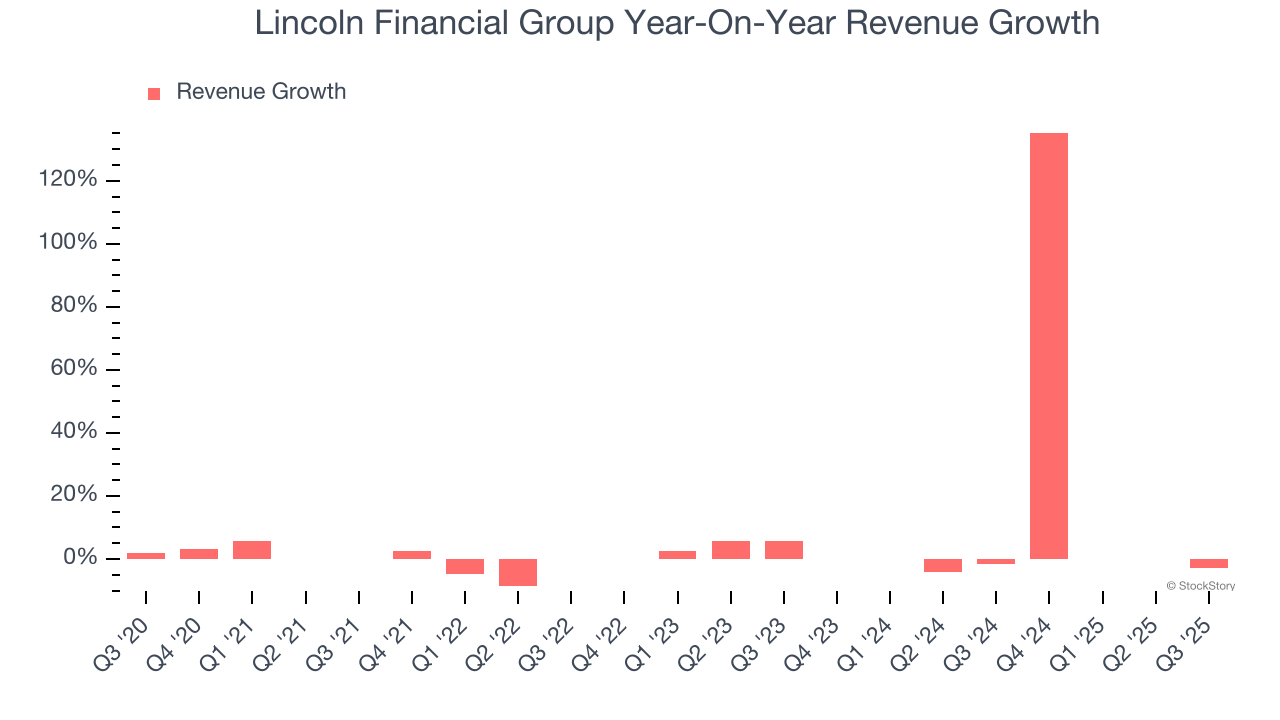 Note: Quarters not shown were determined to be outliers, impacted by outsized investment gains/losses that are not indicative of the recurring fundamentals of the business.
This quarter, Lincoln Financial Group missed Wall Street’s estimates and reported a rather uninspiring 3% year-on-year revenue decline, generating $4.47 billion of revenue.
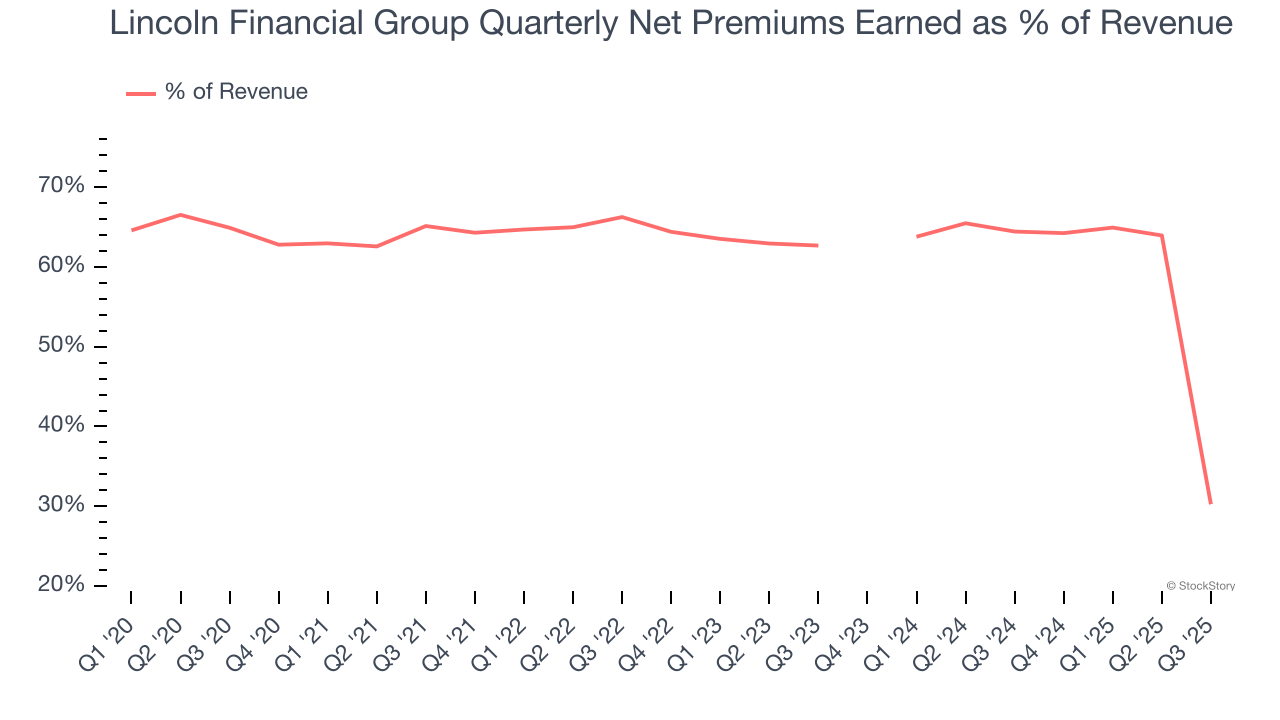
Net premiums earned made up 61.3% of the company’s total revenue during the last five years, meaning insurance operations are Lincoln Financial Group’s largest source of revenue.
 Note: Quarters not shown were determined to be outliers, impacted by outsized investment gains/losses that are not indicative of the recurring fundamentals of the business.
While insurers generate revenue from multiple sources, investors view net premiums earned as the cornerstone - its direct link to core operations stands in sharp contrast to the unpredictability of investment returns and fees.
Here at StockStory, we certainly understand the potential of thematic investing. Diverse winners from Microsoft (MSFT) to Alphabet (GOOG), Coca-Cola (KO) to Monster Beverage (MNST) could all have been identified as promising growth stories with a megatrend driving the growth. So, in that spirit, we’ve identified a relatively under-the-radar profitable growth stock benefiting from the rise of AI, available to you FREE via this link.
Book Value Per Share (BVPS)
Insurance companies are balance sheet businesses, collecting premiums upfront and paying out claims over time. The float – premiums collected but not yet paid out – are invested, creating an asset base supported by a liability structure. Book value captures this dynamic by measuring:
- Assets (investment portfolio, cash, reinsurance recoverables) - liabilities (claim reserves, debt, future policy benefits)
BVPS is essentially the residual value for shareholders.
We therefore consider BVPS very important to track for insurers and a metric that sheds light on business quality because it reflects long-term capital growth and is harder to manipulate than more commonly-used metrics like EPS.
Lincoln Financial Group’s BVPS declined at a 9% annual clip over the last five years. However, BVPS growth has accelerated recently, growing by 131% annually over the last two years from $13.04 to $69.66 per share.
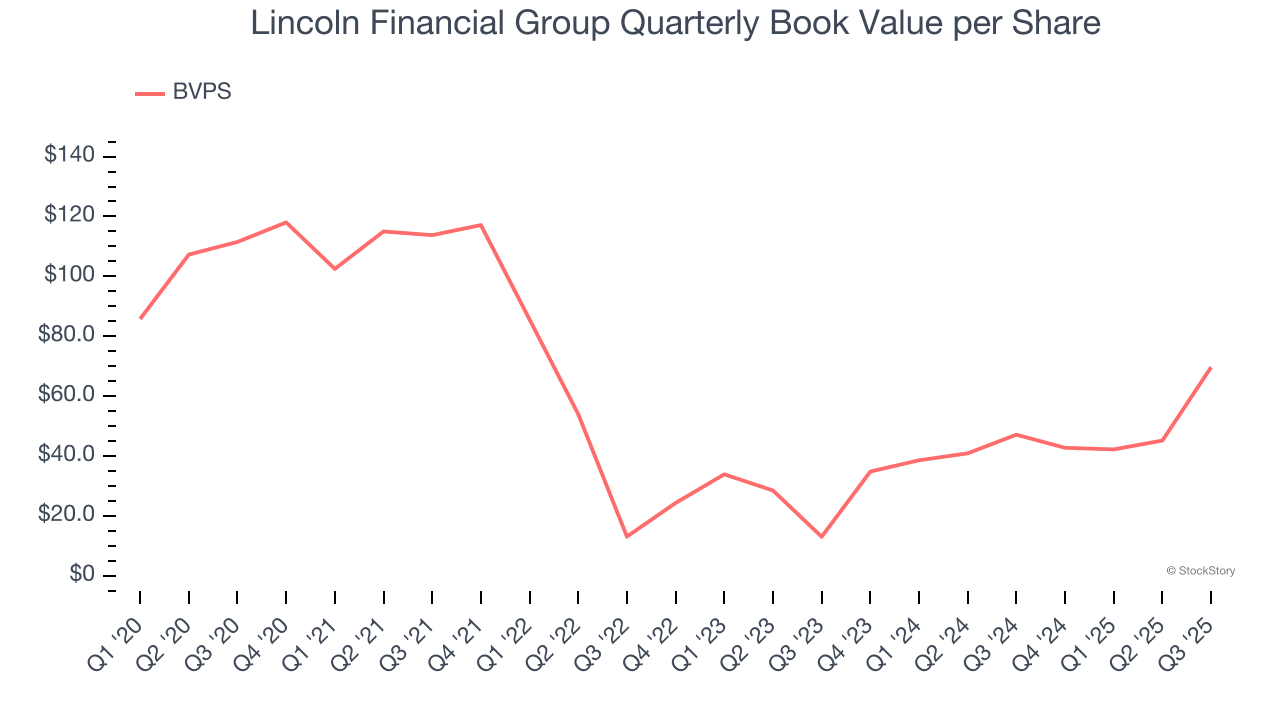
Over the next 12 months, Consensus estimates call for Lincoln Financial Group’s BVPS to grow by 8.4% to $69.42, mediocre growth rate.
Key Takeaways from Lincoln Financial Group’s Q3 Results
It was good to see Lincoln Financial Group beat analysts’ EPS expectations this quarter. On the other hand, its revenue missed and its net premiums earned fell short of Wall Street’s estimates. Overall, this was a mixed quarter. The stock traded up 1.1% to $40.50 immediately after reporting.
Is Lincoln Financial Group an attractive investment opportunity right now? What happened in the latest quarter matters, but not as much as longer-term business quality and valuation, when deciding whether to invest in this stock. We cover that in our actionable full research report which you can read here, it’s free for active Edge members.


