Medical device company ResMed (NYSE: RMD) met Wall Streets revenue expectations in Q3 CY2025, with sales up 9.1% year on year to $1.34 billion. Its non-GAAP profit of $2.55 per share was 2.1% above analysts’ consensus estimates.
Is now the time to buy ResMed? Find out by accessing our full research report, it’s free for active Edge members.
ResMed (RMD) Q3 CY2025 Highlights:
- Revenue: $1.34 billion vs analyst estimates of $1.34 billion (9.1% year-on-year growth, in line)
- Adjusted EPS: $2.55 vs analyst estimates of $2.50 (2.1% beat)
- Adjusted EBITDA: $515.4 million vs analyst estimates of $508.6 million (38.6% margin, 1.3% beat)
- Operating Margin: 33.4%, up from 31.6% in the same quarter last year
- Free Cash Flow Margin: 31%, up from 25.1% in the same quarter last year
- Constant Currency Revenue rose 8% year on year (11% in the same quarter last year)
- Market Capitalization: $37.01 billion
“Our fiscal year 2026 is off to a strong start, with first-quarter performance reflecting continued progress toward our mission of helping people sleep better, breathe better and live longer and healthier, with care provided in their own home,” said Resmed’s Chairman and CEO, Mick Farrell.
Company Overview
Founded in 1989 to address the then-underdiagnosed condition of sleep apnea, ResMed (NYSE: RMD) develops cloud-connected medical devices and software solutions that treat sleep apnea, COPD, and other respiratory disorders for home and clinical use.
Revenue Growth
A company’s long-term performance is an indicator of its overall quality. Any business can have short-term success, but a top-tier one grows for years. Thankfully, ResMed’s 11.7% annualized revenue growth over the last five years was decent. Its growth was slightly above the average healthcare company and shows its offerings resonate with customers.
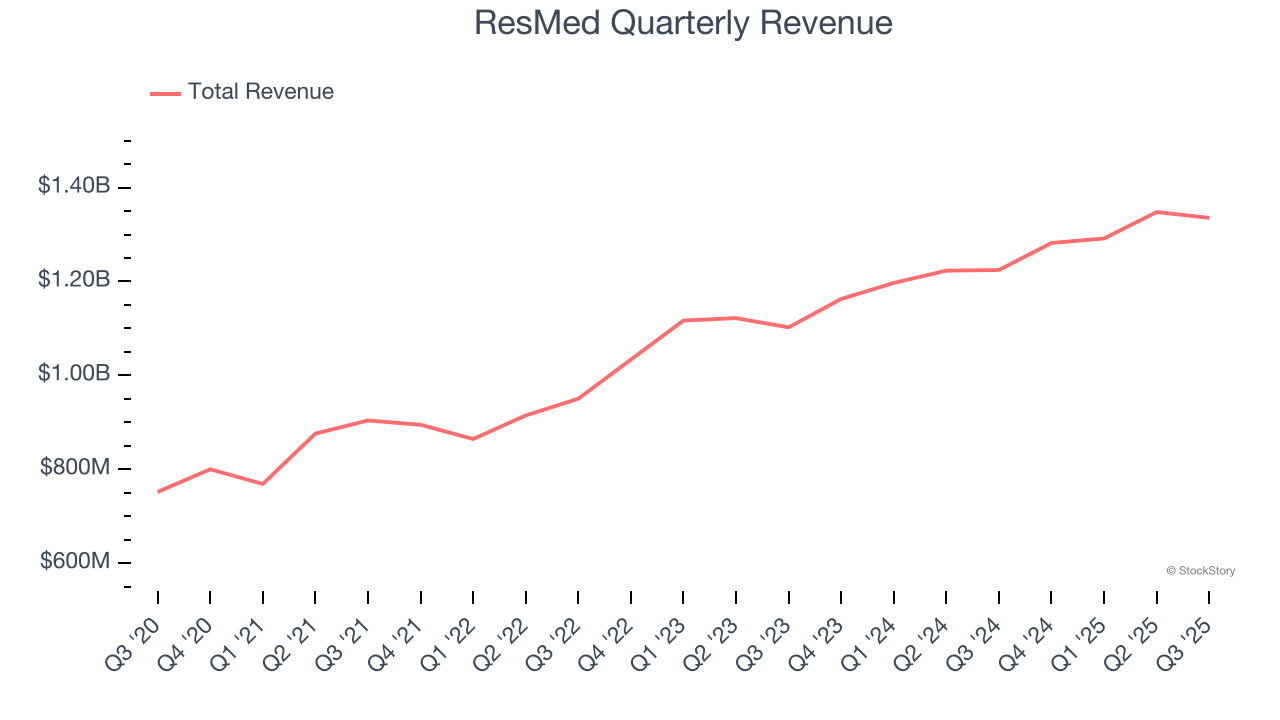
Long-term growth is the most important, but within healthcare, a half-decade historical view may miss new innovations or demand cycles. ResMed’s annualized revenue growth of 9.6% over the last two years is below its five-year trend, but we still think the results were respectable. 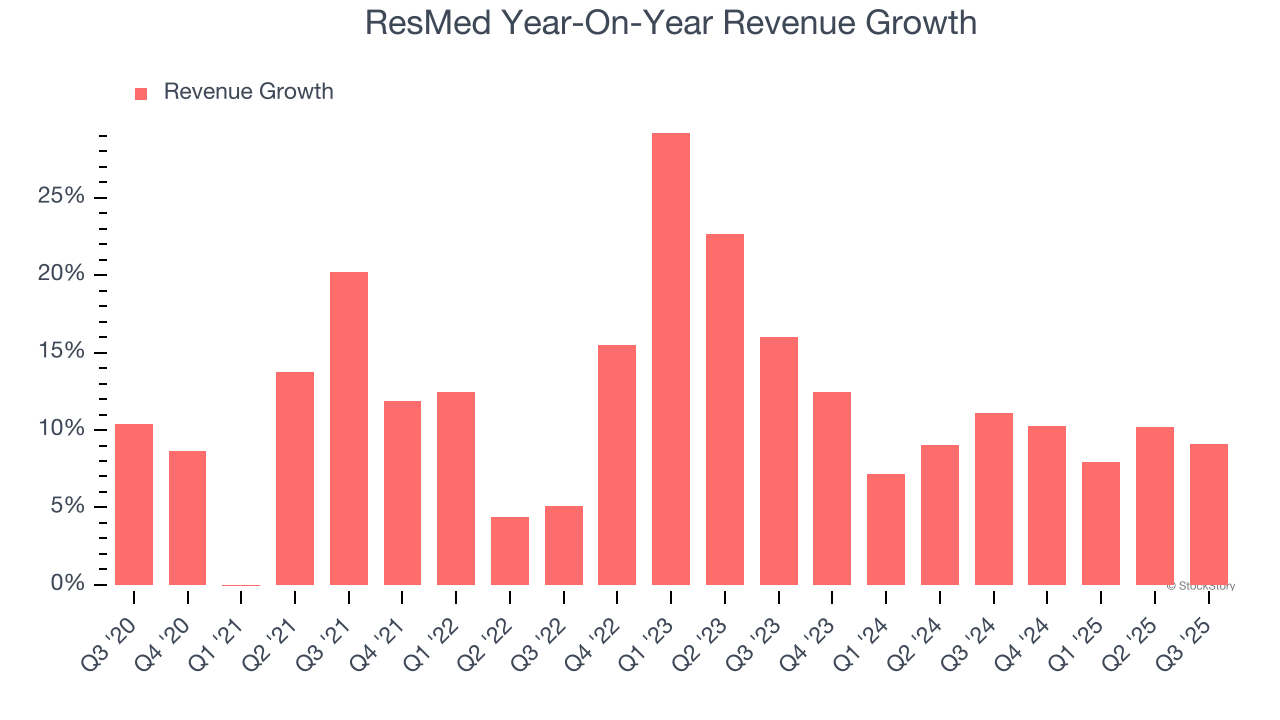
ResMed also reports sales performance excluding currency movements, which are outside the company’s control and not indicative of demand. Over the last two years, its constant currency sales averaged 9.4% year-on-year growth. Because this number aligns with its normal revenue growth, we can see that ResMed has properly hedged its foreign currency exposure. 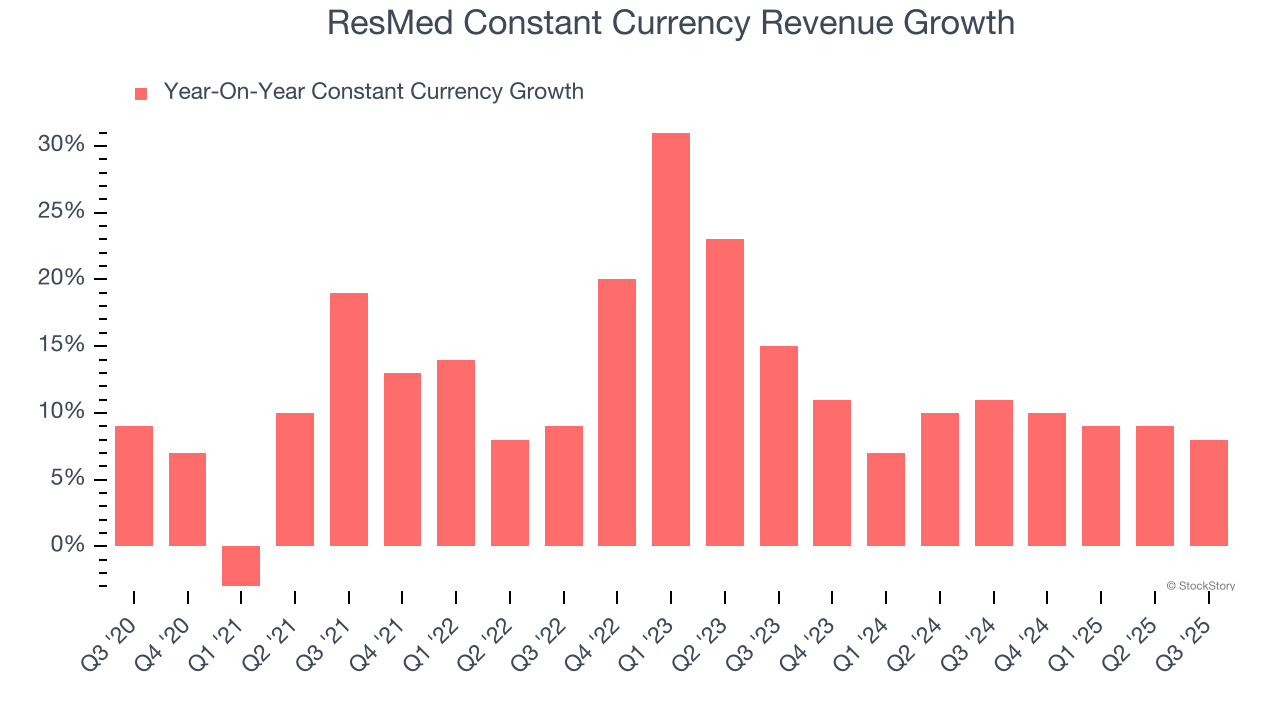
This quarter, ResMed grew its revenue by 9.1% year on year, and its $1.34 billion of revenue was in line with Wall Street’s estimates.
Looking ahead, sell-side analysts expect revenue to grow 8.7% over the next 12 months, similar to its two-year rate. This projection is commendable and indicates the market is baking in success for its products and services.
Here at StockStory, we certainly understand the potential of thematic investing. Diverse winners from Microsoft (MSFT) to Alphabet (GOOG), Coca-Cola (KO) to Monster Beverage (MNST) could all have been identified as promising growth stories with a megatrend driving the growth. So, in that spirit, we’ve identified a relatively under-the-radar profitable growth stock benefiting from the rise of AI, available to you FREE via this link.
Operating Margin
Operating margin is one of the best measures of profitability because it tells us how much money a company takes home after subtracting all core expenses, like marketing and R&D.
ResMed has been an efficient company over the last five years. It was one of the more profitable businesses in the healthcare sector, boasting an average operating margin of 29.3%.
Looking at the trend in its profitability, ResMed’s operating margin rose by 4.9 percentage points over the last five years, as its sales growth gave it operating leverage. This performance was mostly driven by its recent improvements as the company’s margin has increased by 7 percentage points on a two-year basis. These data points are very encouraging and show momentum is on its side.
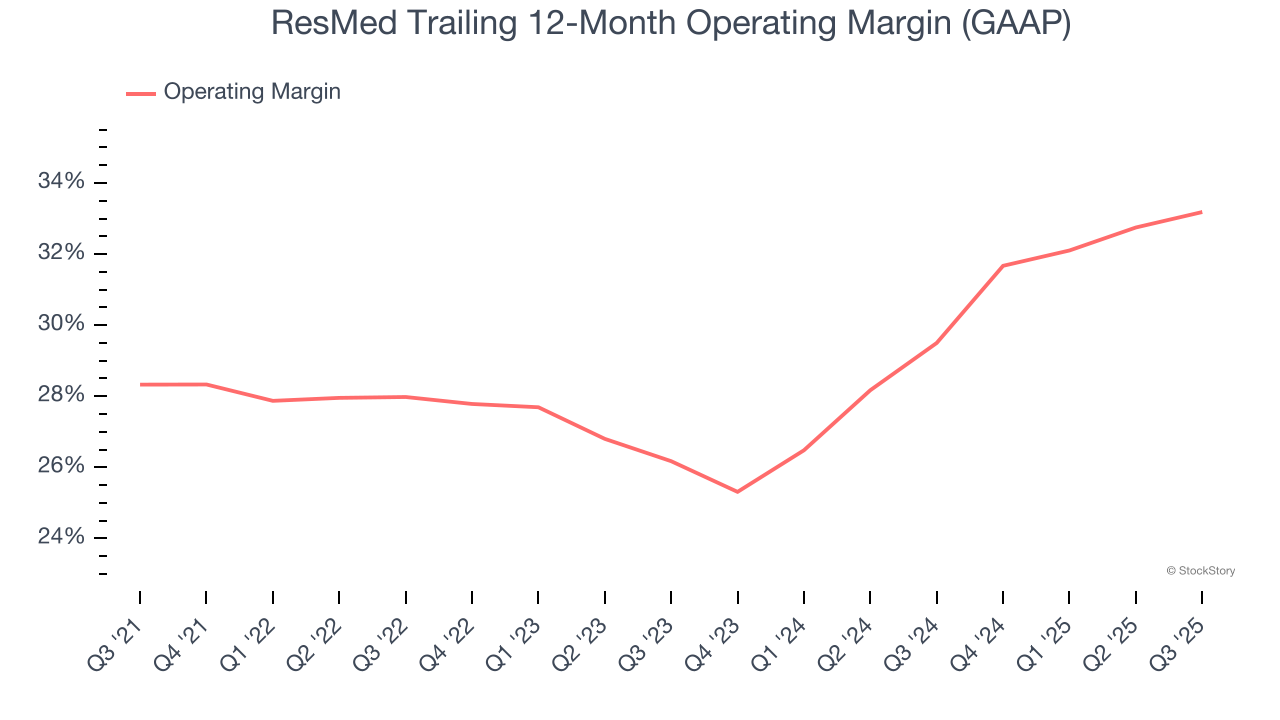
In Q3, ResMed generated an operating margin profit margin of 33.4%, up 1.8 percentage points year on year. This increase was a welcome development and shows it was more efficient.
Earnings Per Share
We track the long-term change in earnings per share (EPS) for the same reason as long-term revenue growth. Compared to revenue, however, EPS highlights whether a company’s growth is profitable.
ResMed’s EPS grew at a spectacular 14.2% compounded annual growth rate over the last five years, higher than its 11.7% annualized revenue growth. This tells us the company became more profitable on a per-share basis as it expanded.
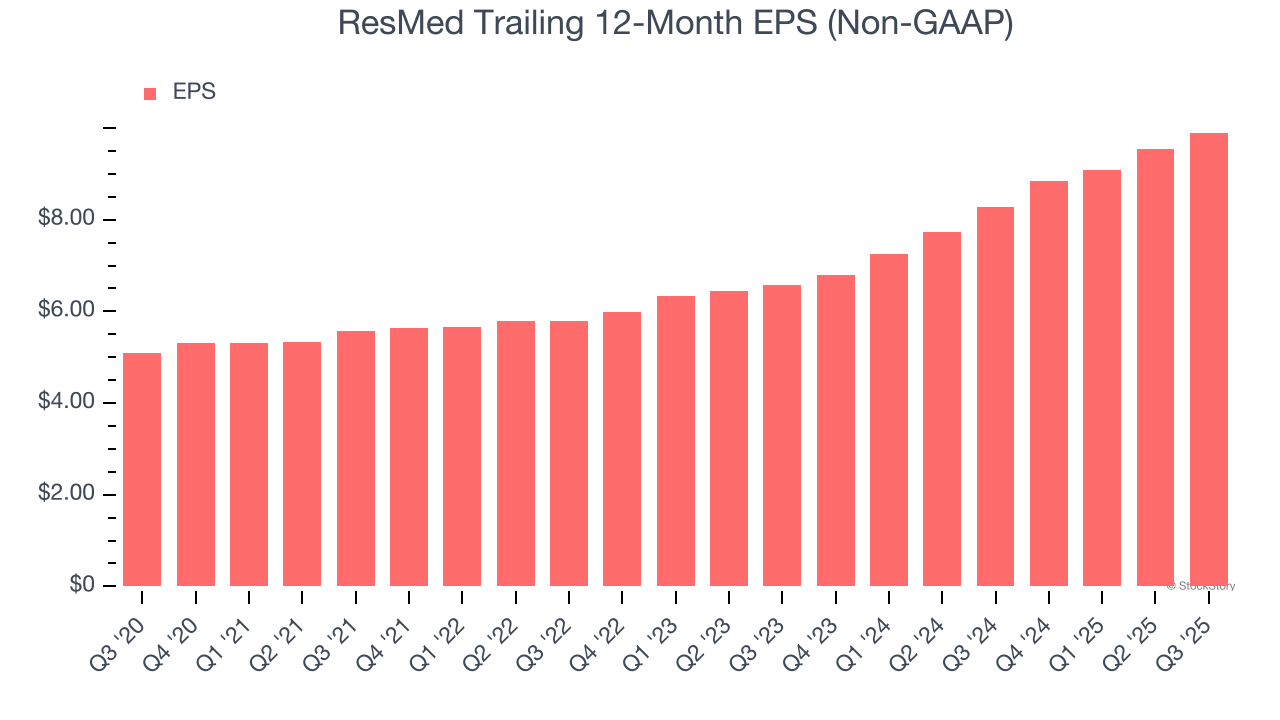
We can take a deeper look into ResMed’s earnings quality to better understand the drivers of its performance. As we mentioned earlier, ResMed’s operating margin expanded by 4.9 percentage points over the last five years. This was the most relevant factor (aside from the revenue impact) behind its higher earnings; interest expenses and taxes can also affect EPS but don’t tell us as much about a company’s fundamentals.
In Q3, ResMed reported adjusted EPS of $2.55, up from $2.20 in the same quarter last year. This print beat analysts’ estimates by 2.1%. Over the next 12 months, Wall Street expects ResMed’s full-year EPS of $9.90 to grow 11.7%.
Key Takeaways from ResMed’s Q3 Results
Revenue was just in line but EPS beat on operating margin that improved nicely year on year. Overall, this quarter was decent. The stock remained flat at $251 immediately following the results.
So should you invest in ResMed right now? When making that decision, it’s important to consider its valuation, business qualities, as well as what has happened in the latest quarter. We cover that in our actionable full research report which you can read here, it’s free for active Edge members.


