
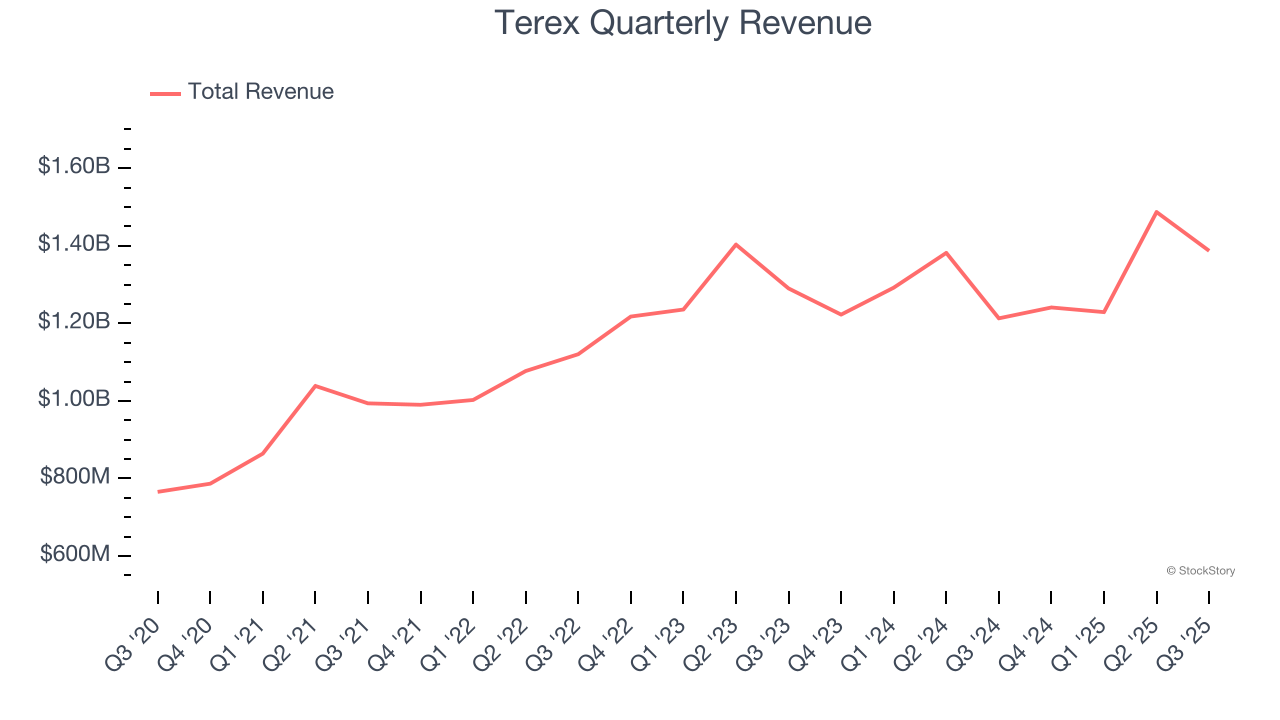
Lifting and material handling equipment company Terex (NYSE: TEX) fell short of the markets revenue expectations in Q3 CY2025, but sales rose 14.3% year on year to $1.39 billion. The company’s full-year revenue guidance of $5.4 billion at the midpoint came in 0.9% below analysts’ estimates. Its non-GAAP profit of $1.50 per share was 24.5% above analysts’ consensus estimates.
Is now the time to buy Terex? Find out by accessing our full research report, it’s free for active Edge members.
Terex (TEX) Q3 CY2025 Highlights:
- Revenue: $1.39 billion vs analyst estimates of $1.41 billion (14.3% year-on-year growth, 2% miss)
- Adjusted EPS: $1.50 vs analyst estimates of $1.21 (24.5% beat)
- Adjusted EBITDA: $181 million vs analyst estimates of $169.5 million (13% margin, 6.8% beat)
- The company reconfirmed its revenue guidance for the full year of $5.4 billion at the midpoint
- Management reiterated its full-year Adjusted EPS guidance of $4.90 at the midpoint
- EBITDA guidance for the full year is $640 million at the midpoint, below analyst estimates of $679.1 million
- Operating Margin: 10.1%, in line with the same quarter last year
- Free Cash Flow Margin: 9.4%, up from 7.2% in the same quarter last year
- Market Capitalization: $3.63 billion
Company Overview
With humble beginnings as a dump truck company, Terex (NYSE: TEX) today manufactures lifting and material handling equipment designed to move and hoist heavy goods and materials.
Revenue Growth
A company’s long-term sales performance is one signal of its overall quality. Any business can experience short-term success, but top-performing ones enjoy sustained growth for years. Thankfully, Terex’s 11% annualized revenue growth over the last five years was impressive. Its growth beat the average industrials company and shows its offerings resonate with customers.
We at StockStory place the most emphasis on long-term growth, but within industrials, a half-decade historical view may miss cycles, industry trends, or a company capitalizing on catalysts such as a new contract win or a successful product line. Terex’s recent performance shows its demand has slowed significantly as its annualized revenue growth of 1.9% over the last two years was well below its five-year trend. We also note many other Construction Machinery businesses have faced declining sales because of cyclical headwinds. While Terex grew slower than we’d like, it did do better than its peers. 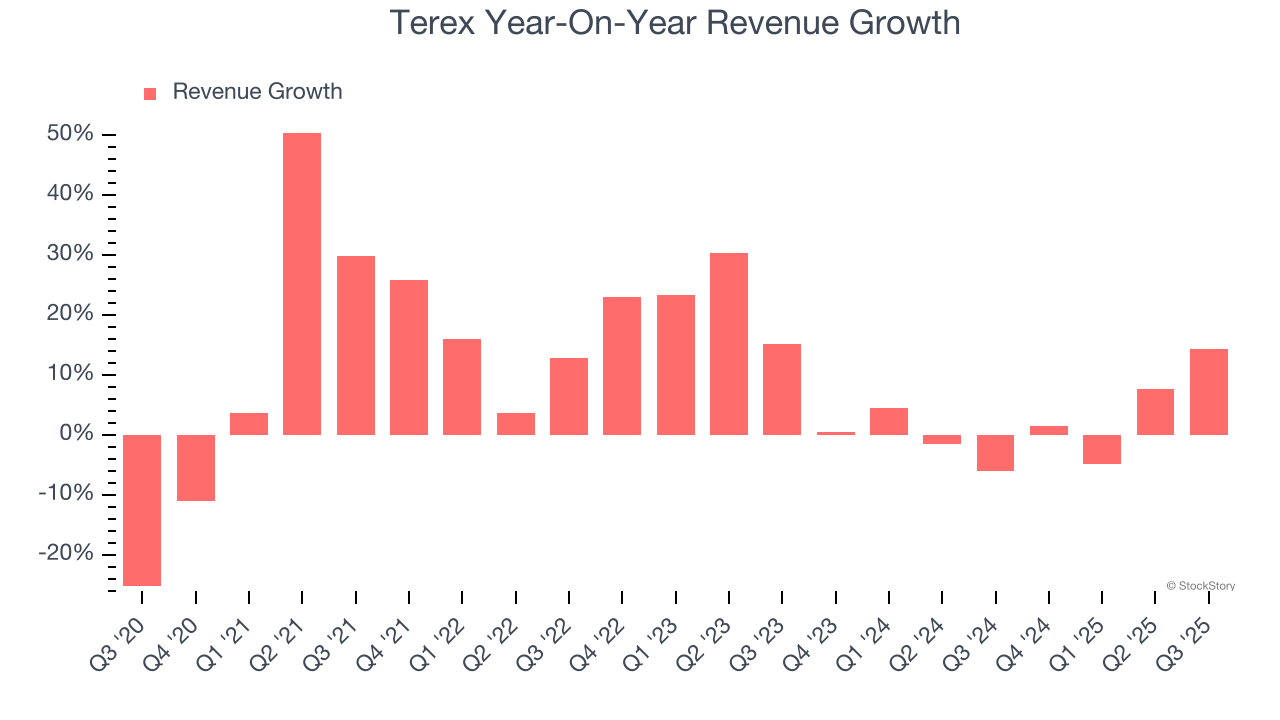
This quarter, Terex’s revenue grew by 14.3% year on year to $1.39 billion but fell short of Wall Street’s estimates.
Looking ahead, sell-side analysts expect revenue to grow 5.2% over the next 12 months. Although this projection indicates its newer products and services will spur better top-line performance, it is still below average for the sector.
Today’s young investors won’t have read the timeless lessons in Gorilla Game: Picking Winners In High Technology because it was written more than 20 years ago when Microsoft and Apple were first establishing their supremacy. But if we apply the same principles, then enterprise software stocks leveraging their own generative AI capabilities may well be the Gorillas of the future. So, in that spirit, we are excited to present our Special Free Report on a profitable, fast-growing enterprise software stock that is already riding the automation wave and looking to catch the generative AI next.
Operating Margin
Operating margin is one of the best measures of profitability because it tells us how much money a company takes home after procuring and manufacturing its products, marketing and selling those products, and most importantly, keeping them relevant through research and development.
Terex’s operating margin might fluctuated slightly over the last 12 months but has generally stayed the same, averaging 9.7% over the last five years. This profitability was higher than the broader industrials sector, showing it did a decent job managing its expenses.
Analyzing the trend in its profitability, Terex’s operating margin might fluctuated slightly but has generally stayed the same over the last five years. This raises questions about the company’s expense base because its revenue growth should have given it leverage on its fixed costs, resulting in better economies of scale and profitability.
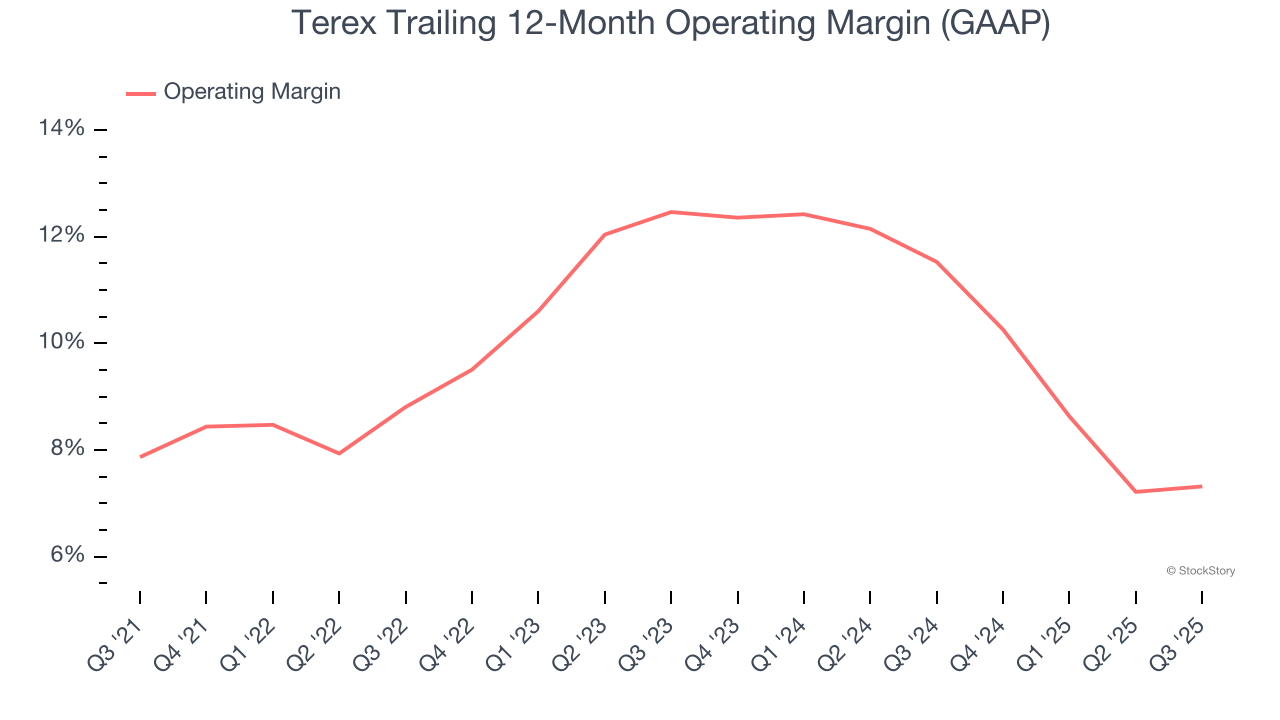
This quarter, Terex generated an operating margin profit margin of 10.1%, in line with the same quarter last year. This indicates the company’s cost structure has recently been stable.
Earnings Per Share
Revenue trends explain a company’s historical growth, but the long-term change in earnings per share (EPS) points to the profitability of that growth – for example, a company could inflate its sales through excessive spending on advertising and promotions.
Terex’s EPS grew at an astounding 76.2% compounded annual growth rate over the last five years, higher than its 11% annualized revenue growth. This tells us the company became more profitable on a per-share basis as it expanded.
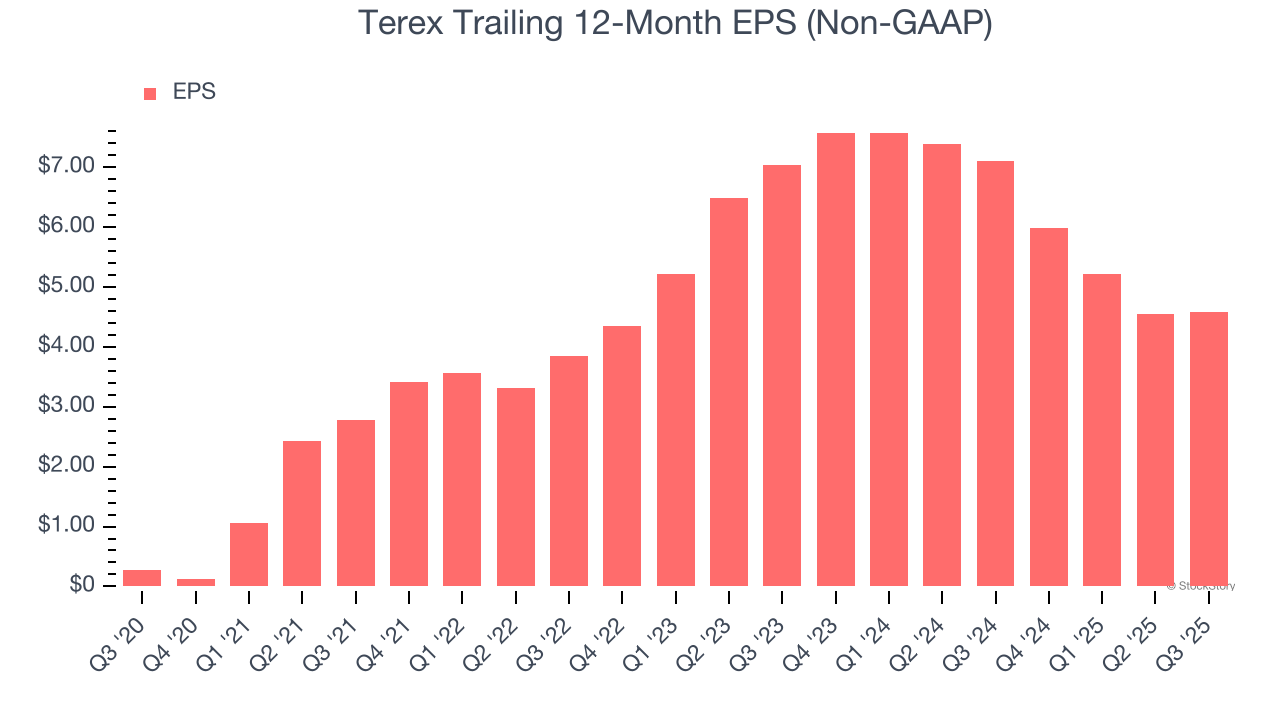
Diving into the nuances of Terex’s earnings can give us a better understanding of its performance. A five-year view shows that Terex has repurchased its stock, shrinking its share count by 4.7%. This tells us its EPS outperformed its revenue not because of increased operational efficiency but financial engineering, as buybacks boost per share earnings. 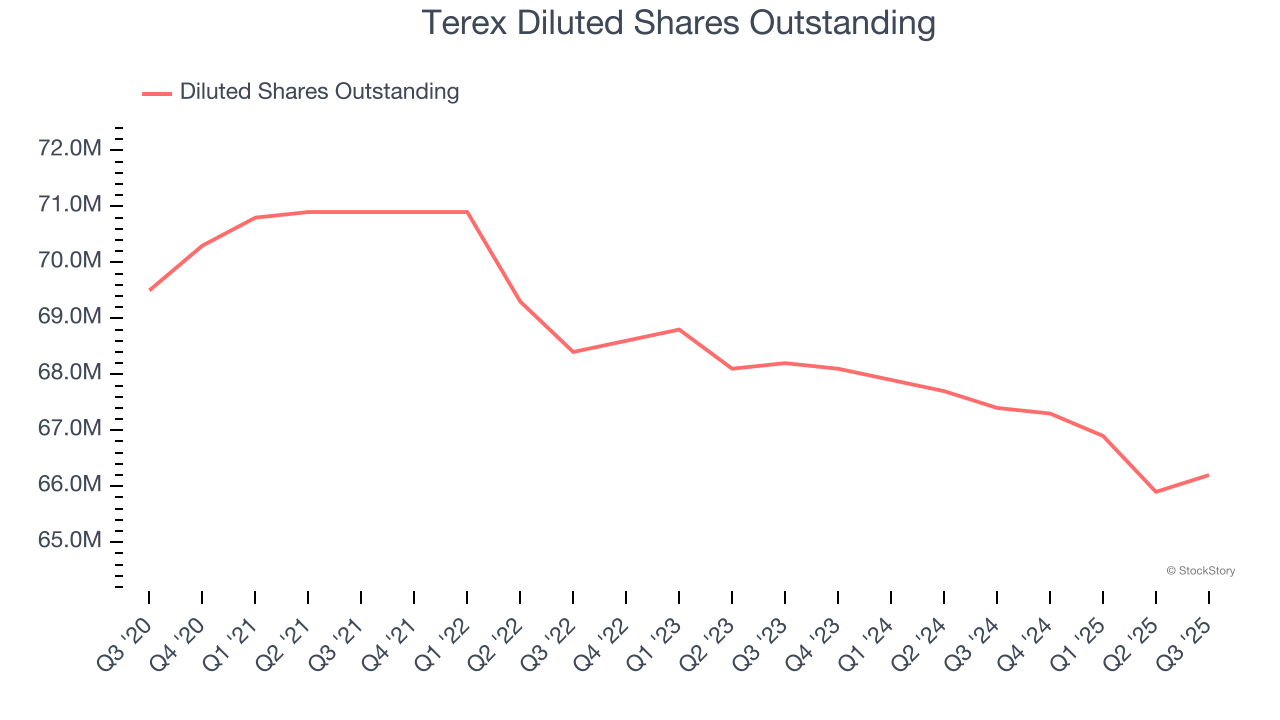
Like with revenue, we analyze EPS over a more recent period because it can provide insight into an emerging theme or development for the business.
For Terex, its two-year annual EPS declines of 19.3% mark a reversal from its (seemingly) healthy five-year trend. We hope Terex can return to earnings growth in the future.
In Q3, Terex reported adjusted EPS of $1.50, up from $1.46 in the same quarter last year. This print easily cleared analysts’ estimates, and shareholders should be content with the results. Over the next 12 months, Wall Street expects Terex’s full-year EPS of $4.59 to grow 18.4%.
Key Takeaways from Terex’s Q3 Results
It was good to see Terex beat analysts’ EPS expectations this quarter. We were also glad its EBITDA outperformed Wall Street’s estimates. On the other hand, its full-year EBITDA guidance missed and its revenue fell short of Wall Street’s estimates. Overall, this was a weaker quarter. The stock traded down 4.4% to $53.49 immediately after reporting.
Is Terex an attractive investment opportunity at the current price? When making that decision, it’s important to consider its valuation, business qualities, as well as what has happened in the latest quarter. We cover that in our actionable full research report which you can read here, it’s free for active Edge members.


