
Financial services company The Bancorp (NASDAQ: TBBK) fell short of the markets revenue expectations in Q3 CY2025, but sales rose 38.8% year on year to $174.6 million. Its GAAP profit of $1.18 per share was 11.3% below analysts’ consensus estimates.
Is now the time to buy The Bancorp? Find out by accessing our full research report, it’s free for active Edge members.
The Bancorp (TBBK) Q3 CY2025 Highlights:
- Net Interest Income: $94.2 million vs analyst estimates of $99.6 million (flat year on year, 5.4% miss)
- Net Interest Margin: 4.5% vs analyst estimates of 4.4% (in line)
- Revenue: $174.6 million vs analyst estimates of $193.9 million (38.8% year-on-year growth, 10% miss)
- Efficiency Ratio: 42% vs analyst estimates of 40.5% (150 basis point miss)
- EPS (GAAP): $1.18 vs analyst expectations of $1.33 (11.3% miss)
- Tangible Book Value per Share: $17.48 vs analyst estimates of $17.40 (3.6% year-on-year growth, in line)
- Market Capitalization: $3.58 billion
“We had another successful quarter as we continue to build new Fintech capabilities and implement and expand partner programs,” said Damian Kozlowski, CEO of The Bancorp.
Company Overview
Operating behind the scenes of many popular fintech apps and prepaid cards you might use daily, The Bancorp (NASDAQ: TBBK) is a bank holding company that specializes in providing banking services to fintech companies and offering specialty lending products.
Sales Growth
In general, banks make money from two primary sources. The first is net interest income, which is interest earned on loans, mortgages, and investments in securities minus interest paid out on deposits. The second source is non-interest income, which can come from bank account, credit card, wealth management, investing banking, and trading fees. Luckily, The Bancorp’s revenue grew at an incredible 21% compounded annual growth rate over the last five years. Its growth surpassed the average banking company and shows its offerings resonate with customers, a great starting point for our analysis.
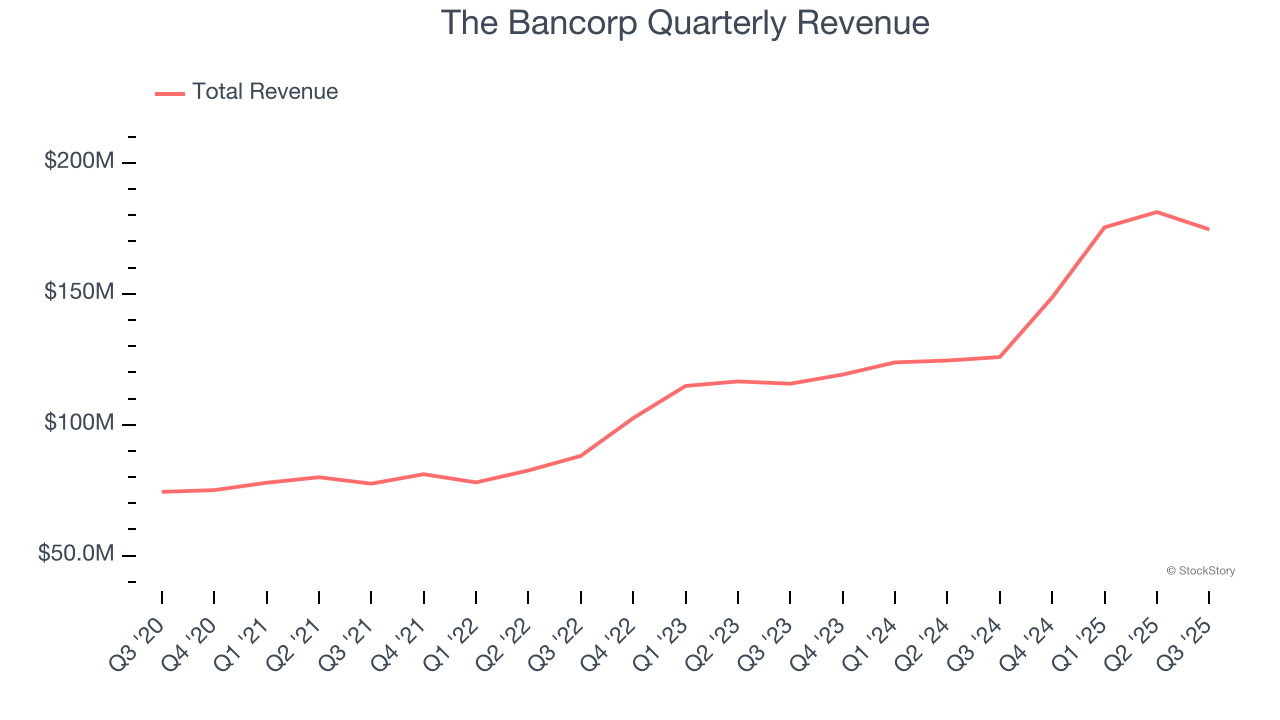
Long-term growth is the most important, but within financials, a half-decade historical view may miss recent interest rate changes and market returns. The Bancorp’s annualized revenue growth of 23% over the last two years is above its five-year trend, suggesting its demand was strong and recently accelerated. 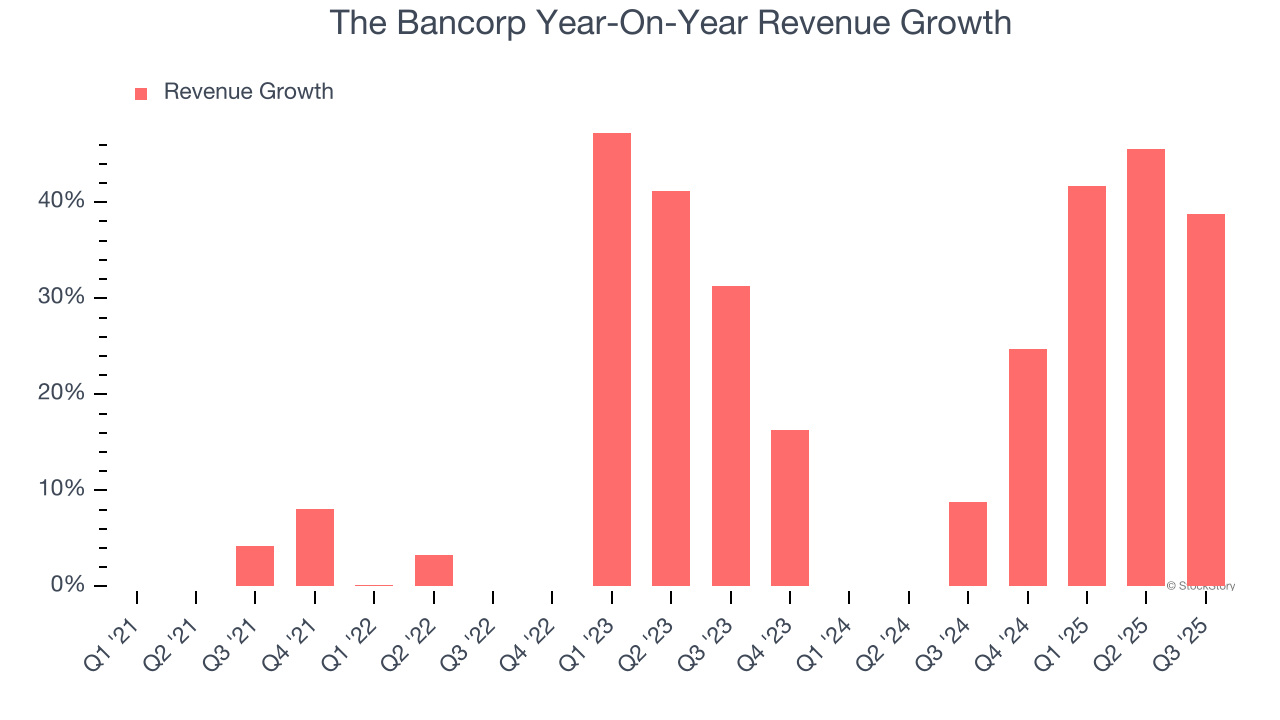 Note: Quarters not shown were determined to be outliers, impacted by outsized investment gains/losses that are not indicative of the recurring fundamentals of the business.
This quarter, The Bancorp pulled off a wonderful 38.8% year-on-year revenue growth rate, but its $174.6 million of revenue fell short of Wall Street’s rosy estimates.
Net interest income made up 68.2% of the company’s total revenue during the last five years, meaning lending operations are The Bancorp’s largest source of revenue.
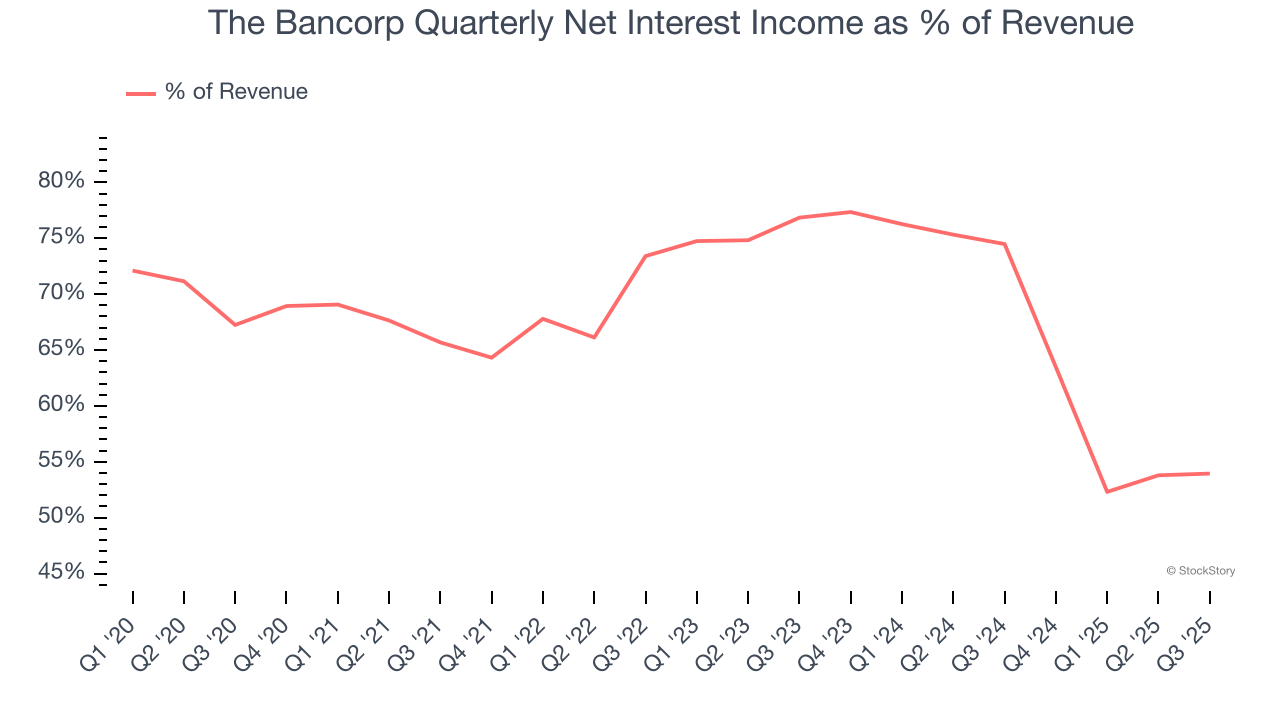
Markets consistently prioritize net interest income growth over fee-based revenue, recognizing its superior quality and recurring nature compared to the more unpredictable non-interest income streams.
Software is eating the world and there is virtually no industry left that has been untouched by it. That drives increasing demand for tools helping software developers do their jobs, whether it be monitoring critical cloud infrastructure, integrating audio and video functionality, or ensuring smooth content streaming. Click here to access a free report on our 3 favorite stocks to play this generational megatrend.
Tangible Book Value Per Share (TBVPS)
Banks operate as balance sheet businesses, with profits generated through borrowing and lending activities. Valuations reflect this reality, emphasizing balance sheet strength and long-term book value compounding ability.
This is why we consider tangible book value per share (TBVPS) the most important metric to track for banks. TBVPS represents the real, liquid net worth per share of a bank, excluding intangible assets that have debatable value upon liquidation. Traditional metrics like EPS are helpful but face distortion from M&A activity and loan loss accounting rules.
The Bancorp’s TBVPS grew at an incredible 12.6% annual clip over the last five years. TBVPS growth has recently decelerated a bit to 10.4% annual growth over the last two years (from $14.33 to $17.48 per share).
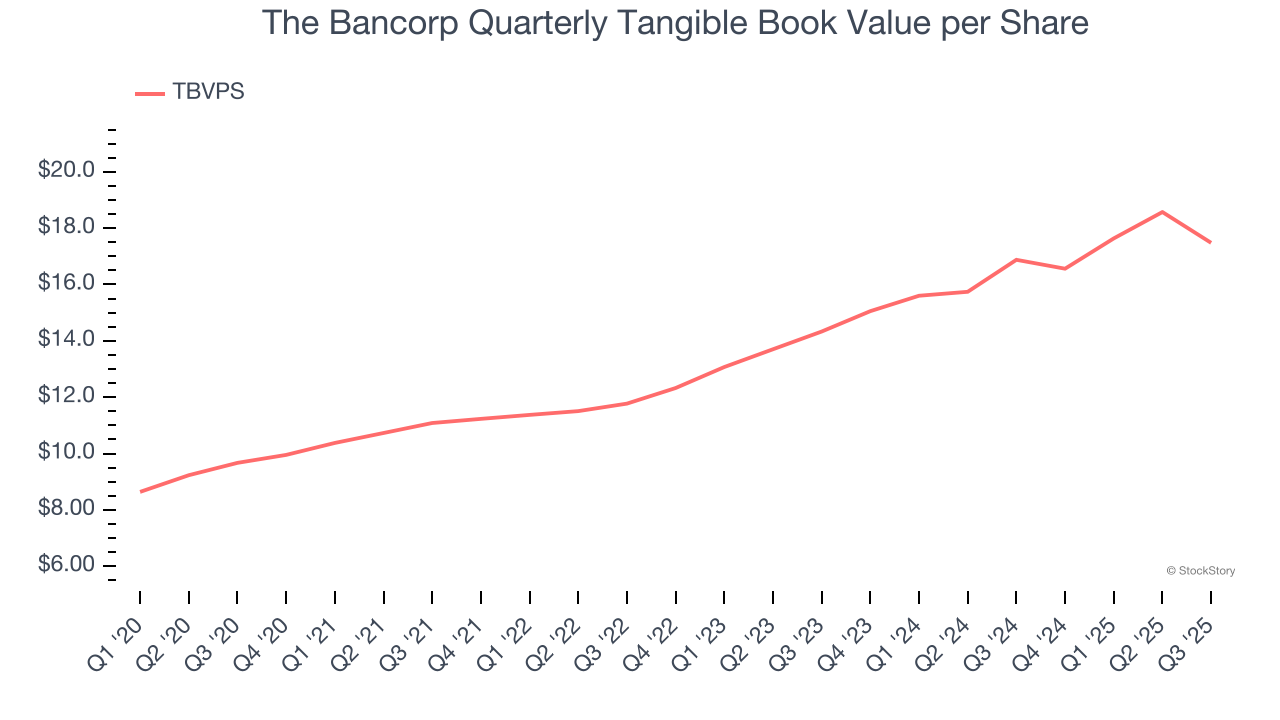
Over the next 12 months, Consensus estimates call for The Bancorp’s TBVPS to grow by 2.8% to $17.97, paltry growth rate.
Key Takeaways from The Bancorp’s Q3 Results
We struggled to find many positives in these results. Its revenue missed and its net interest income fell short of Wall Street’s estimates. Overall, this was a weaker quarter. The stock remained flat at $77.20 immediately following the results.
Big picture, is The Bancorp a buy here and now? If you’re making that decision, you should consider the bigger picture of valuation, business qualities, as well as the latest earnings. We cover that in our actionable full research report which you can read here, it’s free for active Edge members.


