
HVAC company Trane (NYSE: TT) missed Wall Street’s revenue expectations in Q3 CY2025, but sales rose 5.5% year on year to $5.74 billion. Its non-GAAP profit of $3.88 per share was 2.7% above analysts’ consensus estimates.
Is now the time to buy Trane Technologies? Find out by accessing our full research report, it’s free for active Edge members.
Trane Technologies (TT) Q3 CY2025 Highlights:
- Revenue: $5.74 billion vs analyst estimates of $5.79 billion (5.5% year-on-year growth, 0.9% miss)
- Adjusted EPS: $3.88 vs analyst estimates of $3.78 (2.7% beat)
- Adjusted EBITDA: $1.25 billion vs analyst estimates of $1.23 billion (21.8% margin, 1.8% beat)
- Management reiterated its full-year Adjusted EPS guidance of $13 at the midpoint
- Operating Margin: 20.3%, up from 18.8% in the same quarter last year
- Free Cash Flow Margin: 16.6%, down from 22.3% in the same quarter last year
- Backlog: $7.2 billion at quarter end
- Market Capitalization: $95.12 billion
Company Overview
With low-pressure heating systems as its first product, Trane (NYSE: TT) designs, manufactures, and sells HVAC and refrigeration systems, the former to commercial and residential building customers and the latter to commercial truck manufacturers.
Revenue Growth
A company’s long-term performance is an indicator of its overall quality. Any business can have short-term success, but a top-tier one grows for years. Thankfully, Trane Technologies’s 11.1% annualized revenue growth over the last five years was impressive. Its growth surpassed the average industrials company and shows its offerings resonate with customers, a great starting point for our analysis.
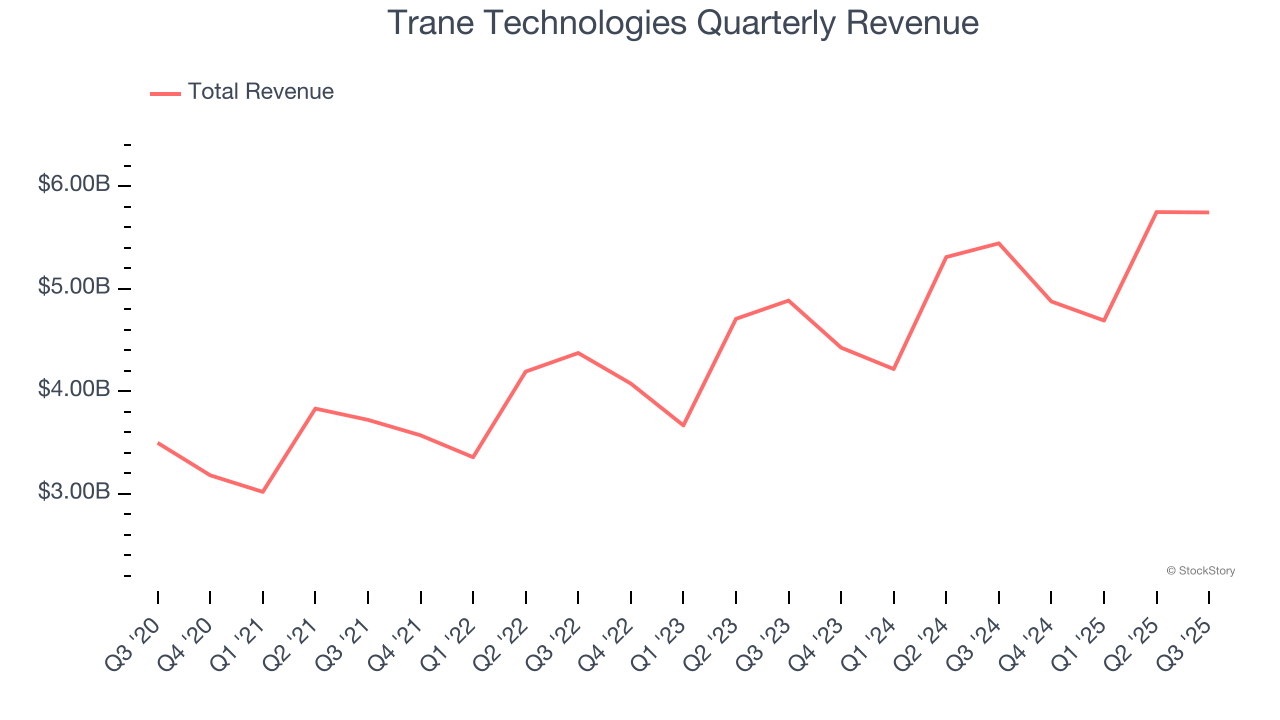
Long-term growth is the most important, but within industrials, a half-decade historical view may miss new industry trends or demand cycles. Trane Technologies’s annualized revenue growth of 10.2% over the last two years aligns with its five-year trend, suggesting its demand was predictably strong. 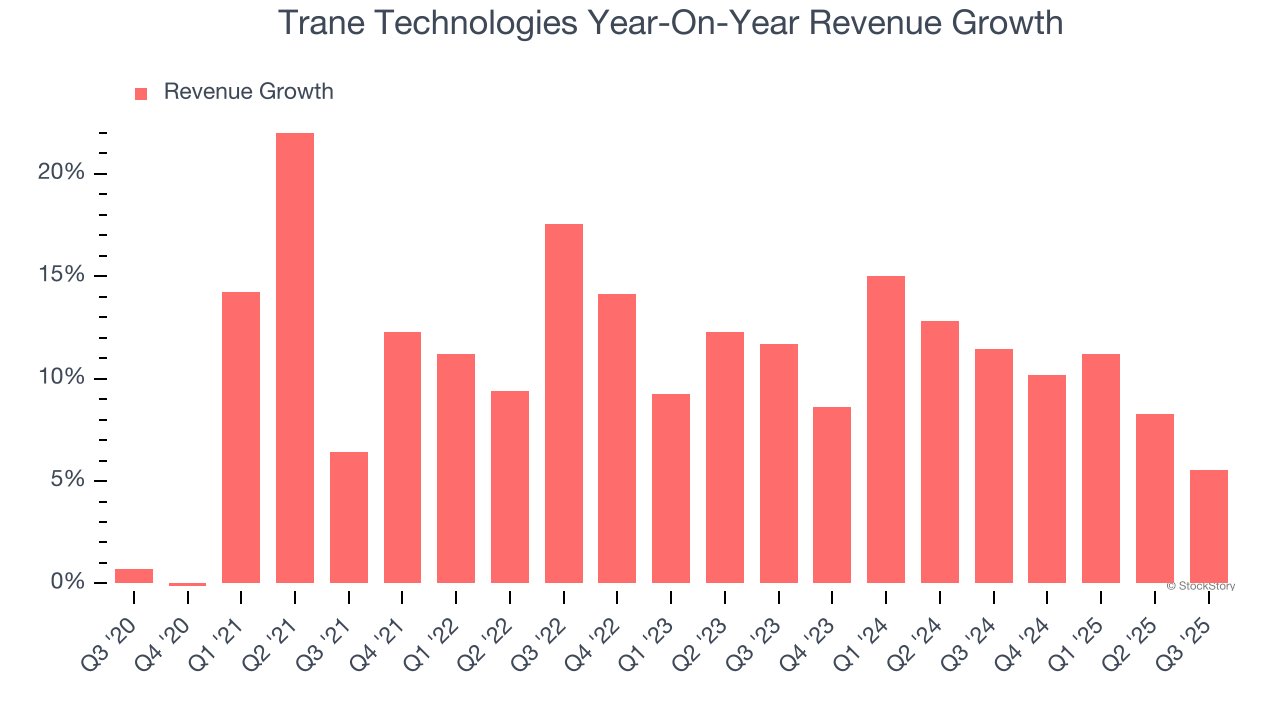
This quarter, Trane Technologies’s revenue grew by 5.5% year on year to $5.74 billion, missing Wall Street’s estimates.
Looking ahead, sell-side analysts expect revenue to grow 7.7% over the next 12 months, a slight deceleration versus the last two years. We still think its growth trajectory is satisfactory given its scale and suggests the market is forecasting success for its products and services.
Here at StockStory, we certainly understand the potential of thematic investing. Diverse winners from Microsoft (MSFT) to Alphabet (GOOG), Coca-Cola (KO) to Monster Beverage (MNST) could all have been identified as promising growth stories with a megatrend driving the growth. So, in that spirit, we’ve identified a relatively under-the-radar profitable growth stock benefiting from the rise of AI, available to you FREE via this link.
Operating Margin
Trane Technologies has been a well-oiled machine over the last five years. It demonstrated elite profitability for an industrials business, boasting an average operating margin of 16.5%. This result isn’t too surprising as its gross margin gives it a favorable starting point.
Looking at the trend in its profitability, Trane Technologies’s operating margin rose by 4.4 percentage points over the last five years, as its sales growth gave it operating leverage.
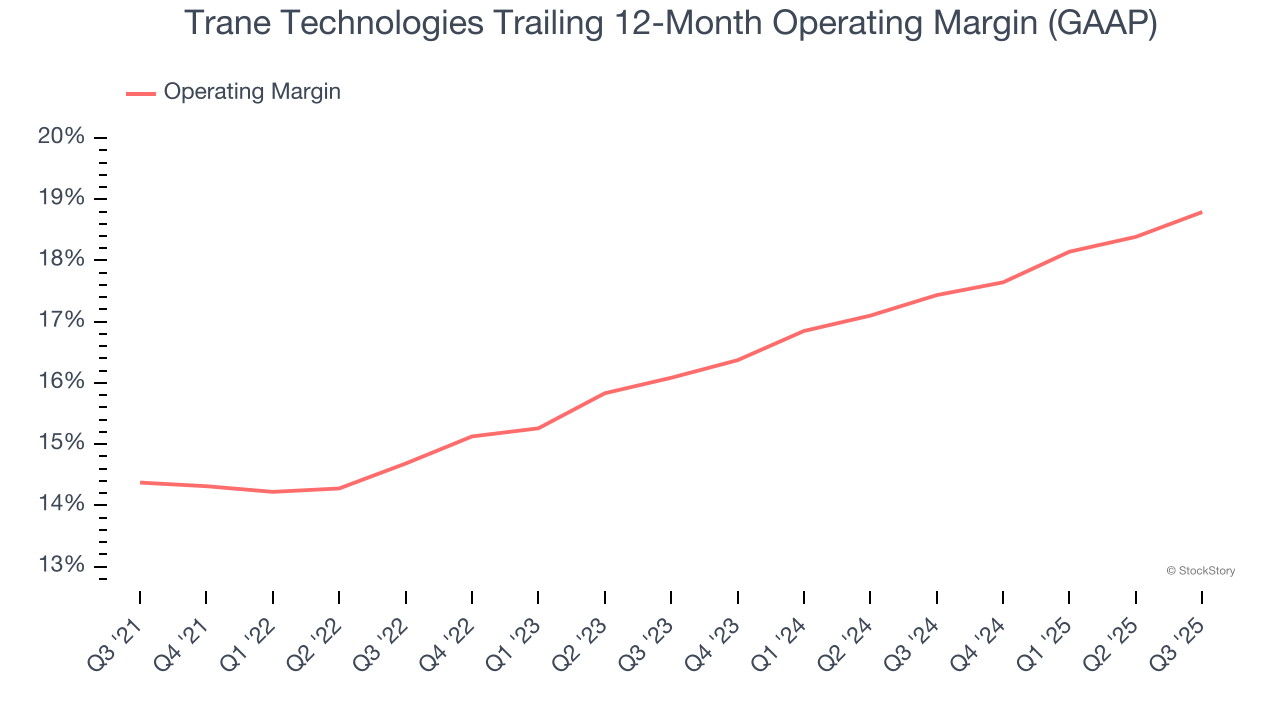
In Q3, Trane Technologies generated an operating margin profit margin of 20.3%, up 1.5 percentage points year on year. The increase was encouraging, and because its operating margin rose more than its gross margin, we can infer it was more efficient with expenses such as marketing, R&D, and administrative overhead.
Earnings Per Share
We track the long-term change in earnings per share (EPS) for the same reason as long-term revenue growth. Compared to revenue, however, EPS highlights whether a company’s growth is profitable.
Trane Technologies’s EPS grew at an astounding 21.6% compounded annual growth rate over the last five years, higher than its 11.1% annualized revenue growth. This tells us the company became more profitable on a per-share basis as it expanded.
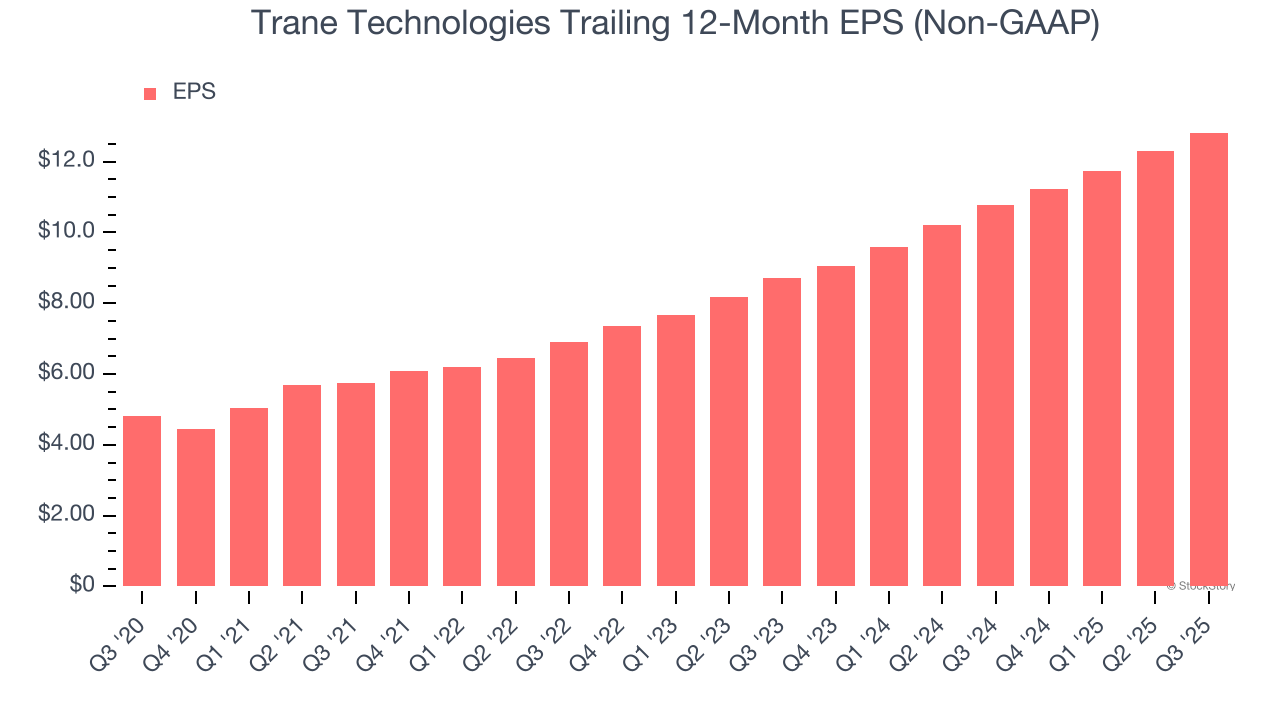
We can take a deeper look into Trane Technologies’s earnings to better understand the drivers of its performance. As we mentioned earlier, Trane Technologies’s operating margin expanded by 4.4 percentage points over the last five years. On top of that, its share count shrank by 7.9%. These are positive signs for shareholders because improving profitability and share buybacks turbocharge EPS growth relative to revenue growth. 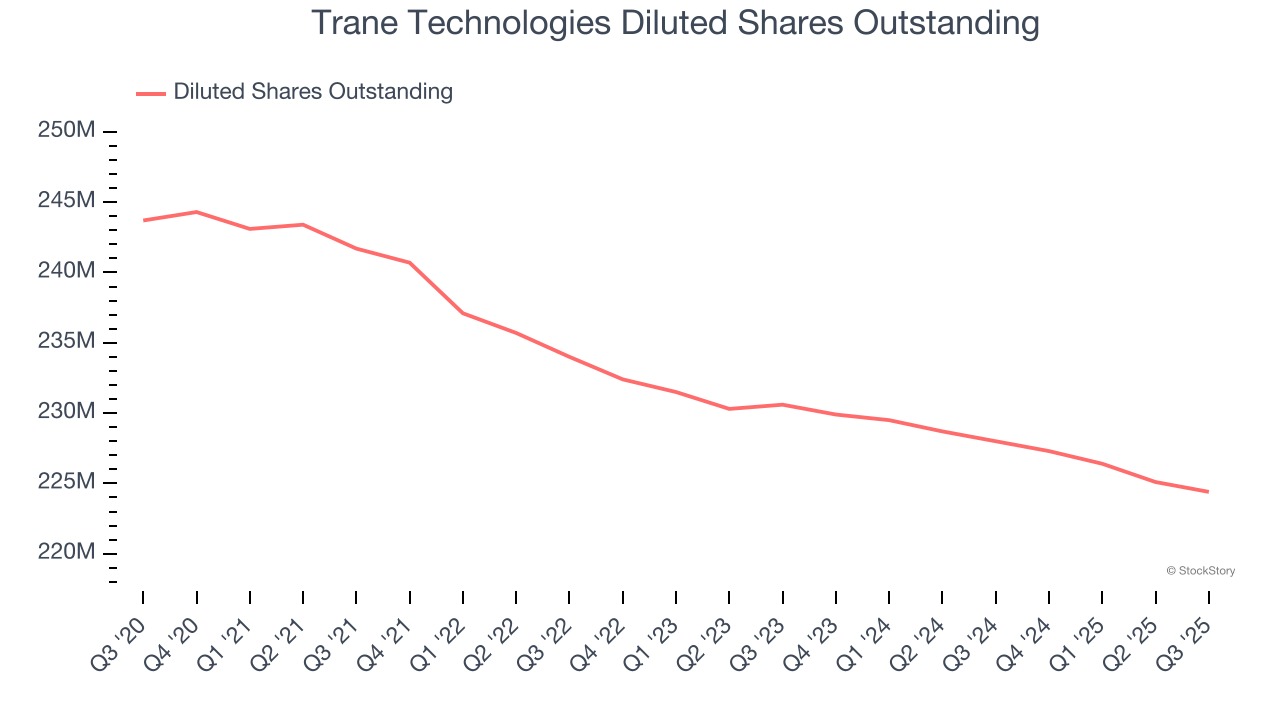
Like with revenue, we analyze EPS over a shorter period to see if we are missing a change in the business.
For Trane Technologies, its two-year annual EPS growth of 21.4% is similar to its five-year trend, implying strong and stable earnings power.
In Q3, Trane Technologies reported adjusted EPS of $3.88, up from $3.37 in the same quarter last year. This print beat analysts’ estimates by 2.7%. Over the next 12 months, Wall Street expects Trane Technologies’s full-year EPS of $12.82 to grow 11.8%.
Key Takeaways from Trane Technologies’s Q3 Results
It was encouraging to see Trane Technologies beat analysts’ EPS expectations this quarter. On the other hand, its revenue slightly missed. Overall, this quarter could have been better. The stock traded down 3.6% to $412.30 immediately following the results.
Should you buy the stock or not? If you’re making that decision, you should consider the bigger picture of valuation, business qualities, as well as the latest earnings. We cover that in our actionable full research report which you can read here, it’s free for active Edge members.


