
Electronic equipment provider Vontier (NYSE: VNT) reported Q3 CY2025 results topping the market’s revenue expectations, but sales were flat year on year at $752.5 million. On the other hand, next quarter’s revenue guidance of $765 million was less impressive, coming in 2% below analysts’ estimates. Its non-GAAP profit of $0.78 per share was 1.5% above analysts’ consensus estimates.
Is now the time to buy Vontier? Find out by accessing our full research report, it’s free for active Edge members.
Vontier (VNT) Q3 CY2025 Highlights:
- Revenue: $752.5 million vs analyst estimates of $747.3 million (flat year on year, 0.7% beat)
- Adjusted EPS: $0.78 vs analyst estimates of $0.77 (1.5% beat)
- Adjusted EBITDA: $172.8 million vs analyst estimates of $171.8 million (23% margin, 0.6% beat)
- Revenue Guidance for Q4 CY2025 is $765 million at the midpoint, below analyst estimates of $780.9 million
- Management slightly raised its full-year Adjusted EPS guidance to $3.18 at the midpoint
- Operating Margin: 18.9%, up from 17.5% in the same quarter last year
- Free Cash Flow Margin: 12%, down from 13.8% in the same quarter last year
- Organic Revenue was flat year on year vs analyst estimates of flat growth (22.9 basis point beat)
- Market Capitalization: $6.27 billion
“Our third quarter performance reflects progress on our Connected Mobility strategy and disciplined execution,” said Mark Morelli, President and Chief Executive Officer.
Company Overview
A spin-off of a spin-off, Vontier (NYSE: VNT) provides electronic products and systems to the transportation, automotive, and manufacturing sectors.
Revenue Growth
A company’s long-term performance is an indicator of its overall quality. Any business can put up a good quarter or two, but many enduring ones grow for years. Over the last five years, Vontier grew its sales at a sluggish 2.9% compounded annual growth rate. This was below our standards and is a rough starting point for our analysis.
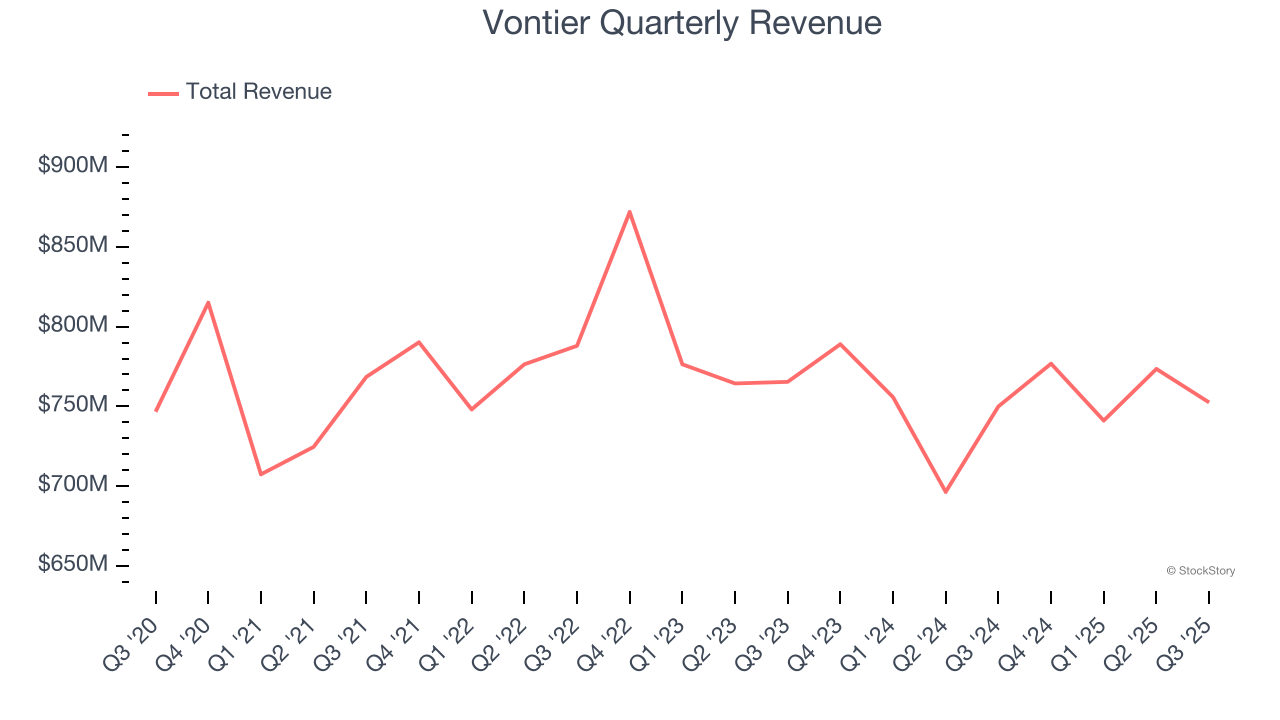
We at StockStory place the most emphasis on long-term growth, but within industrials, a half-decade historical view may miss cycles, industry trends, or a company capitalizing on catalysts such as a new contract win or a successful product line. Vontier’s performance shows it grew in the past but relinquished its gains over the last two years, as its revenue fell by 2.1% annually. Vontier isn’t alone in its struggles as the Internet of Things industry experienced a cyclical downturn, with many similar businesses observing lower sales at this time. 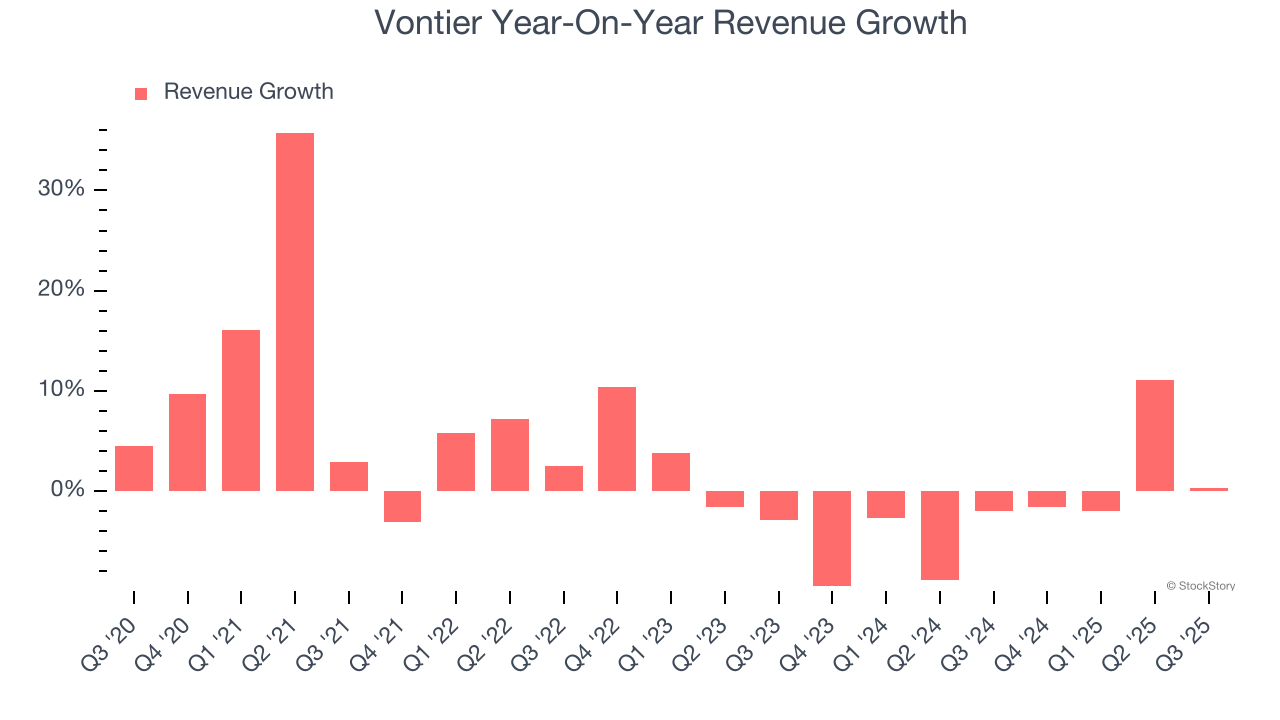
We can dig further into the company’s sales dynamics by analyzing its organic revenue, which strips out one-time events like acquisitions and currency fluctuations that don’t accurately reflect its fundamentals. Over the last two years, Vontier’s organic revenue averaged 1.3% year-on-year growth. Because this number is better than its two-year revenue growth, we can see that some mixture of divestitures and foreign exchange rates dampened its headline results. 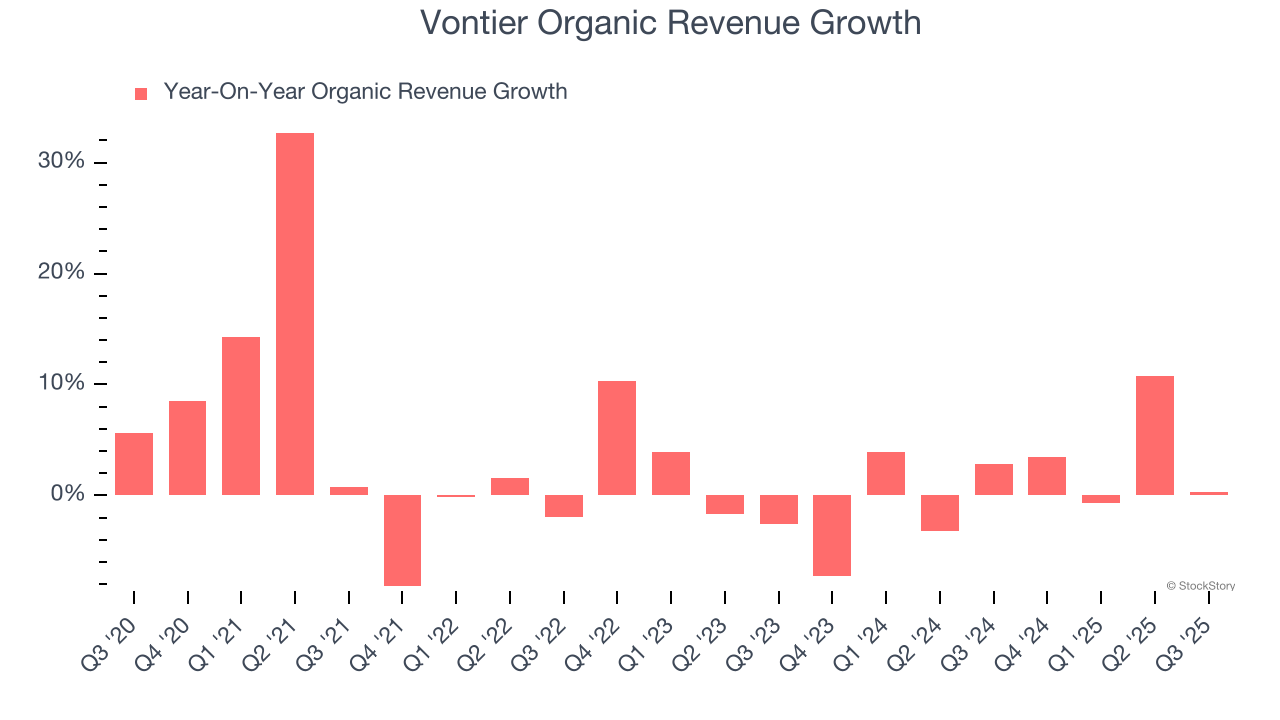
This quarter, Vontier’s $752.5 million of revenue was flat year on year but beat Wall Street’s estimates by 0.7%. Company management is currently guiding for a 1.5% year-on-year decline in sales next quarter.
Looking further ahead, sell-side analysts expect revenue to grow 4% over the next 12 months. While this projection indicates its newer products and services will spur better top-line performance, it is still below average for the sector.
Unless you’ve been living under a rock, it should be obvious by now that generative AI is going to have a huge impact on how large corporations do business. While Nvidia and AMD are trading close to all-time highs, we prefer a lesser-known (but still profitable) stock benefiting from the rise of AI. Click here to access our free report one of our favorites growth stories.
Operating Margin
Operating margin is one of the best measures of profitability because it tells us how much money a company takes home after procuring and manufacturing its products, marketing and selling those products, and most importantly, keeping them relevant through research and development.
Vontier has been a well-oiled machine over the last five years. It demonstrated elite profitability for an industrials business, boasting an average operating margin of 18.4%. This result isn’t surprising as its high gross margin gives it a favorable starting point.
Analyzing the trend in its profitability, Vontier’s operating margin decreased by 1.5 percentage points over the last five years. This raises questions about the company’s expense base because its revenue growth should have given it leverage on its fixed costs, resulting in better economies of scale and profitability.
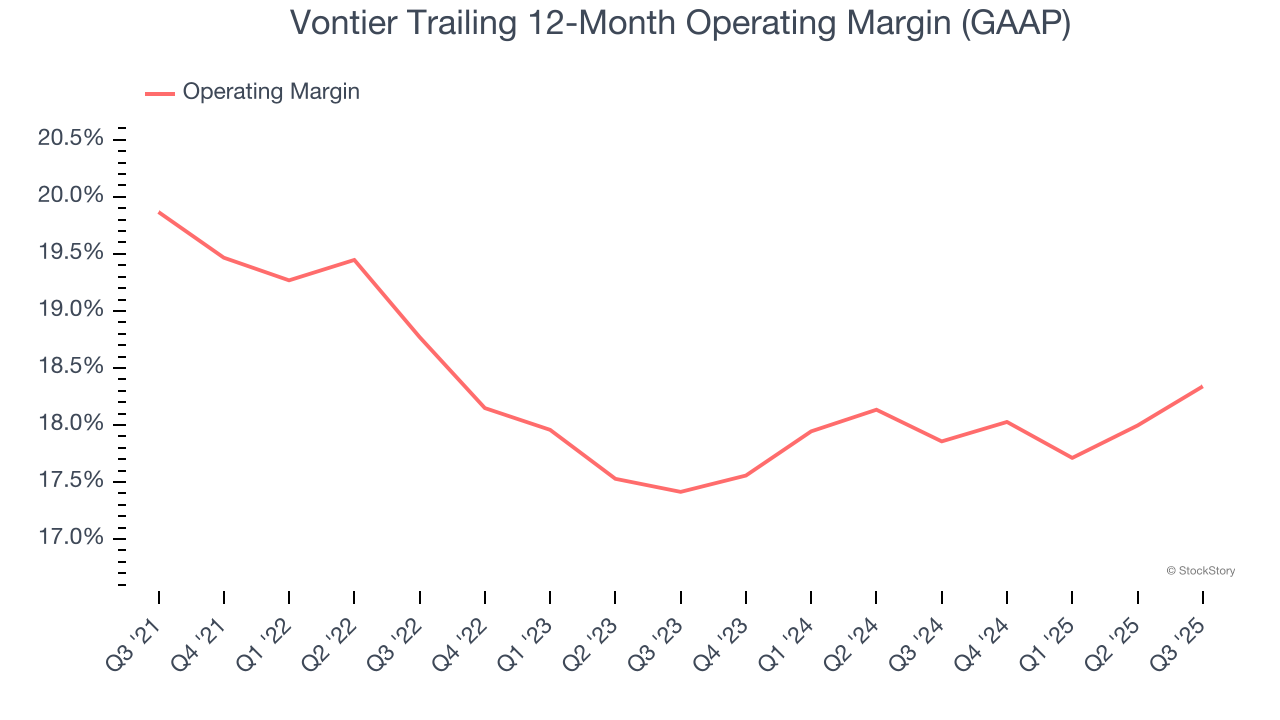
This quarter, Vontier generated an operating margin profit margin of 18.9%, up 1.4 percentage points year on year. The increase was encouraging, and because its operating margin rose more than its gross margin, we can infer it was more efficient with expenses such as marketing, R&D, and administrative overhead.
Earnings Per Share
We track the long-term change in earnings per share (EPS) for the same reason as long-term revenue growth. Compared to revenue, however, EPS highlights whether a company’s growth is profitable.
Vontier’s full-year EPS grew at a weak 1.9% compounded annual growth rate over the last four years, worse than the broader industrials sector.
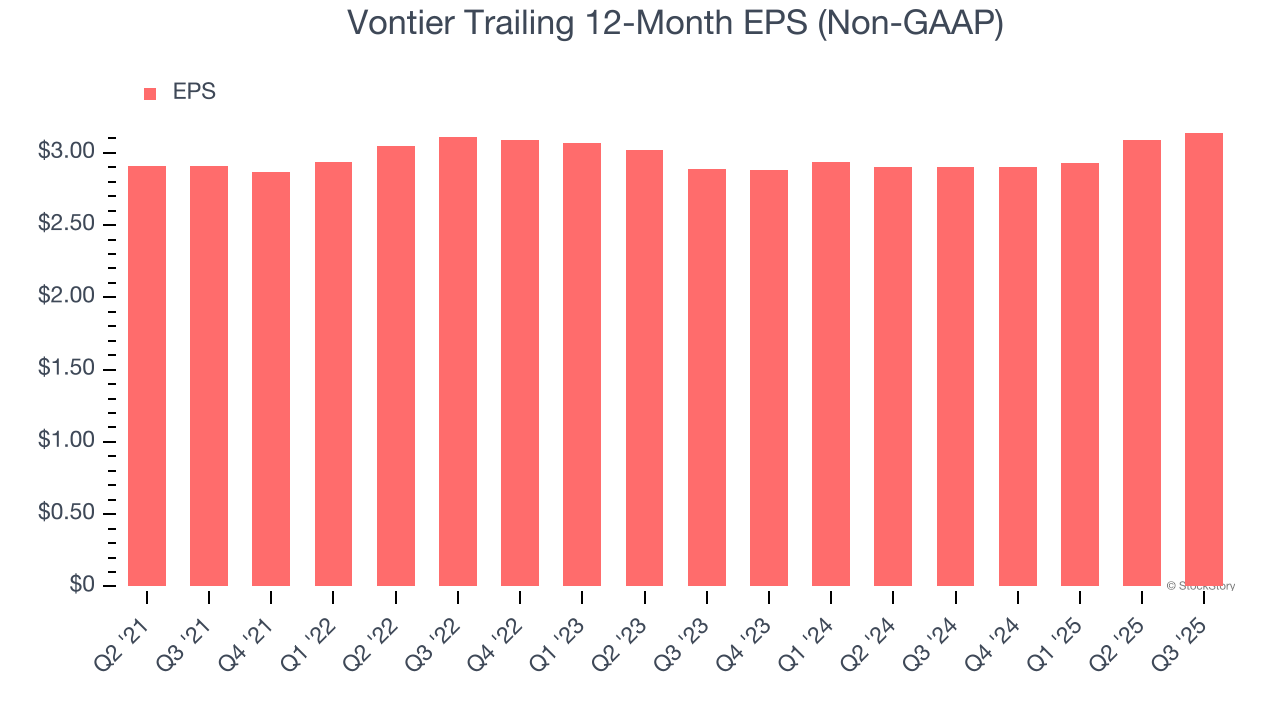
Like with revenue, we analyze EPS over a shorter period to see if we are missing a change in the business.
Vontier’s EPS grew at an unimpressive 4.2% compounded annual growth rate over the last two years. On the bright side, this performance was higher than its 2.1% annualized revenue declines and tells us management adapted its cost structure in response to a challenging demand environment.
Diving into the nuances of Vontier’s earnings can give us a better understanding of its performance. A two-year view shows that Vontier has repurchased its stock, shrinking its share count by 5.4%. This tells us its EPS outperformed its revenue not because of increased operational efficiency but financial engineering, as buybacks boost per share earnings. 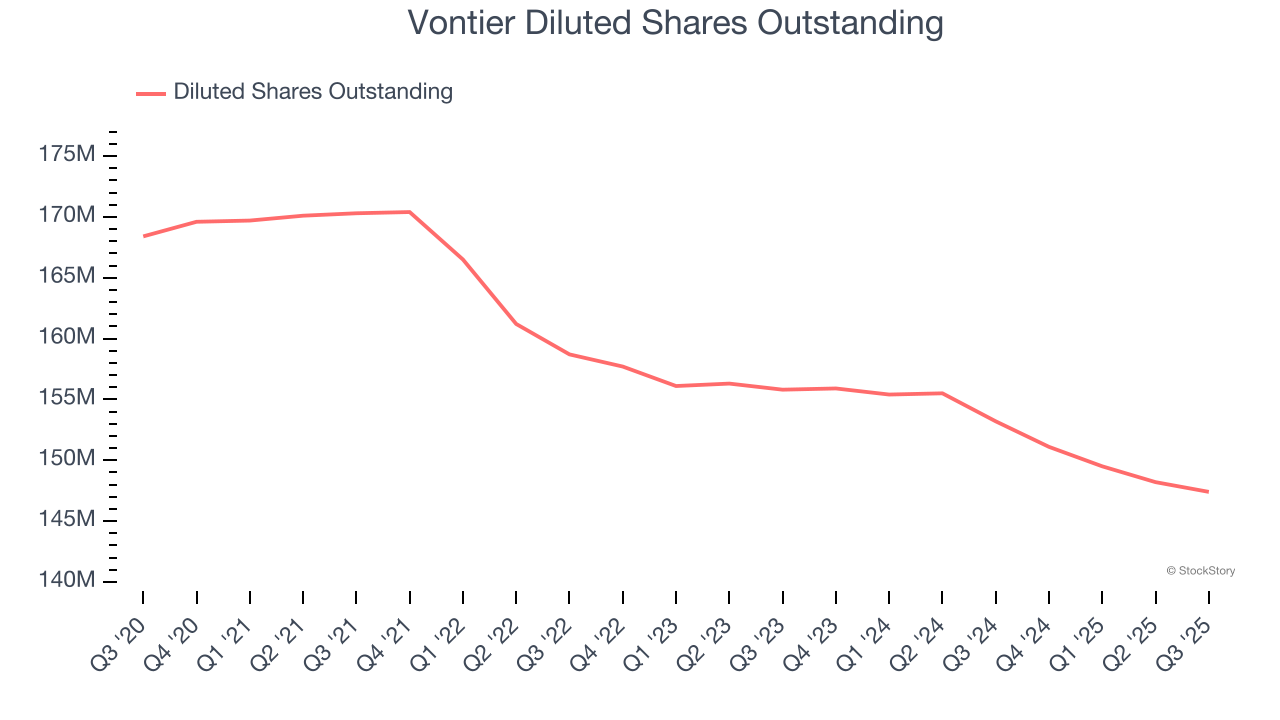
In Q3, Vontier reported adjusted EPS of $0.78, up from $0.73 in the same quarter last year. This print beat analysts’ estimates by 1.5%. Over the next 12 months, Wall Street expects Vontier’s full-year EPS of $3.14 to grow 9.4%.
Key Takeaways from Vontier’s Q3 Results
It was good to see Vontier narrowly top analysts’ revenue expectations this quarter. On the other hand, its EPS guidance for next quarter missed and its revenue guidance for next quarter fell short of Wall Street’s estimates. The guidance is nudging analysts and investors to lower their forward projections. The stock traded down 3.7% to $41.20 immediately following the results.
So do we think Vontier is an attractive buy at the current price? When making that decision, it’s important to consider its valuation, business qualities, as well as what has happened in the latest quarter. We cover that in our actionable full research report which you can read here, it’s free for active Edge members.


