Red Robin has been on fire lately. In the past six months alone, the company’s stock price has rocketed 115%, reaching $7 per share. This was partly thanks to its solid quarterly results, and the run-up might have investors contemplating their next move.
Is there a buying opportunity in Red Robin, or does it present a risk to your portfolio? Dive into our full research report to see our analyst team’s opinion, it’s free for active Edge members.
Why Do We Think Red Robin Will Underperform?
We’re happy investors have made money, but we're sitting this one out for now. Here are three reasons why RRGB doesn't excite us and a stock we'd rather own.
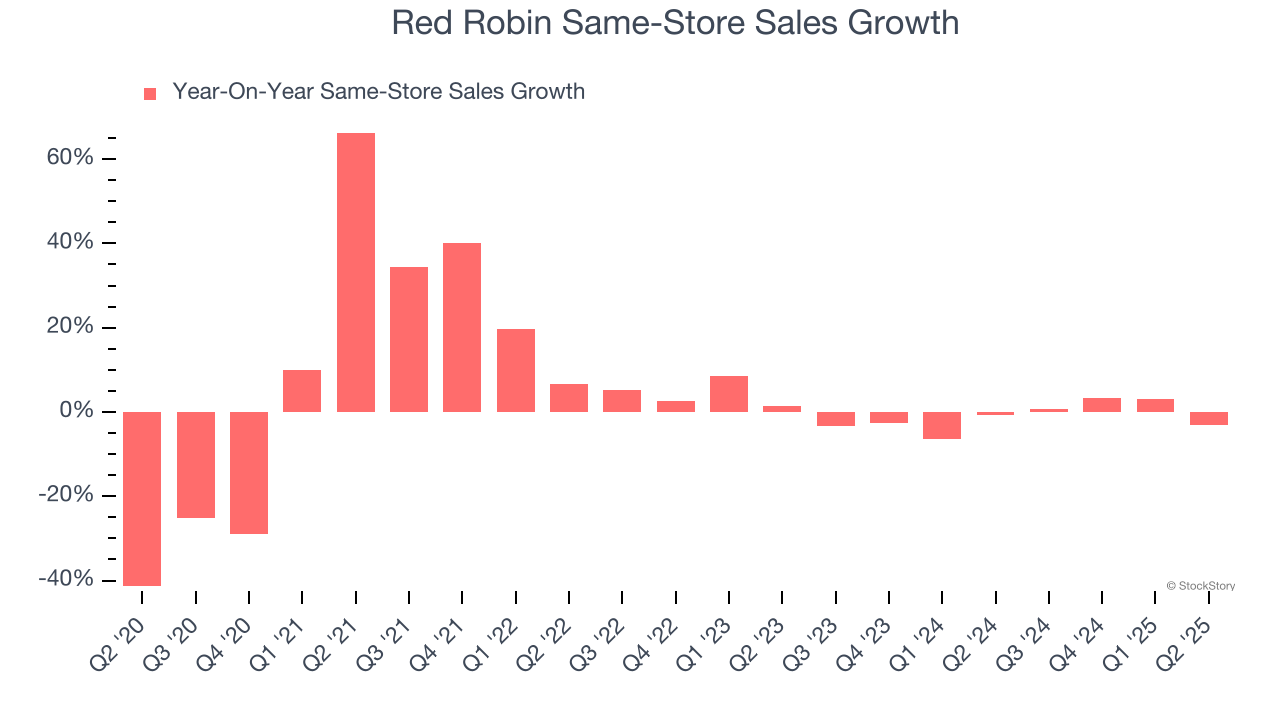
1. Shrinking Same-Store Sales Indicate Waning Demand
Same-store sales show the change in sales at restaurants open for at least a year. This is a key performance indicator because it measures organic growth.
Red Robin’s demand has been shrinking over the last two years as its same-store sales have averaged 1.2% annual declines.
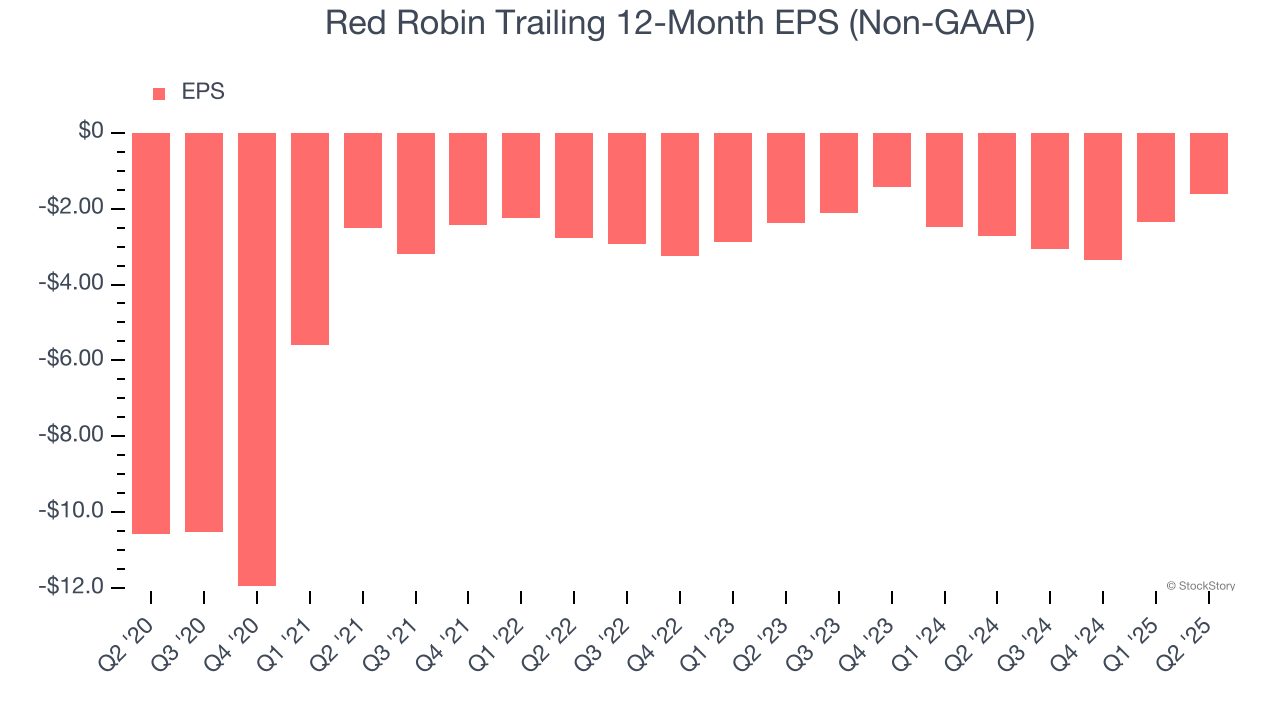
2. EPS Trending Down
We track the long-term change in earnings per share (EPS) because it highlights whether a company’s growth is profitable.
Sadly for Red Robin, its EPS declined by 19.4% annually over the last six years, more than its revenue. This tells us the company struggled because its fixed cost base made it difficult to adjust to shrinking demand.
3. High Debt Levels Increase Risk
As long-term investors, the risk we care about most is the permanent loss of capital, which can happen when a company goes bankrupt or raises money from a disadvantaged position. This is separate from short-term stock price volatility, something we are much less bothered by.
Red Robin’s $523.2 million of debt exceeds the $24.37 million of cash on its balance sheet. Furthermore, its 10× net-debt-to-EBITDA ratio (based on its EBITDA of $52.39 million over the last 12 months) shows the company is overleveraged.
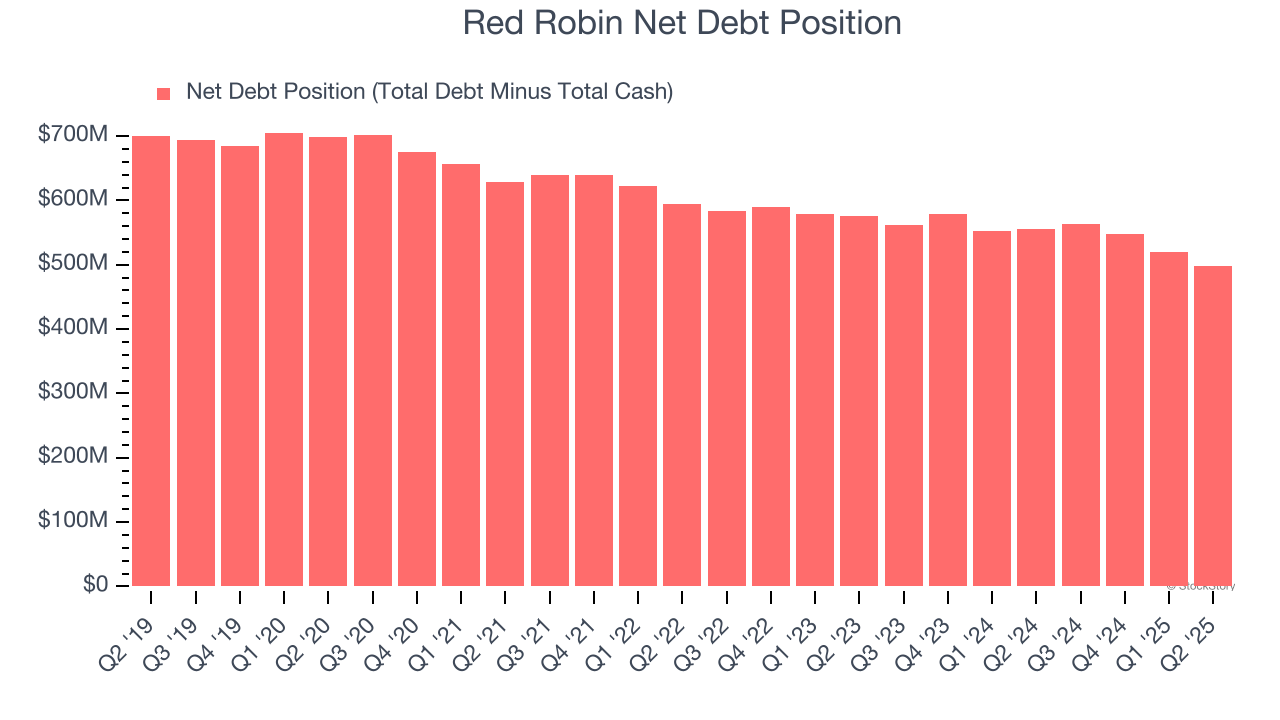
At this level of debt, incremental borrowing becomes increasingly expensive and credit agencies could downgrade the company’s rating if profitability falls. Red Robin could also be backed into a corner if the market turns unexpectedly – a situation we seek to avoid as investors in high-quality companies.
We hope Red Robin can improve its balance sheet and remain cautious until it increases its profitability or pays down its debt.
Final Judgment
We cheer for all companies serving everyday consumers, but in the case of Red Robin, we’ll be cheering from the sidelines. After the recent surge, the stock trades at 2× forward EV-to-EBITDA (or $7 per share). While this valuation is optically cheap, the potential downside is huge given its shaky fundamentals. There are better investments elsewhere. We’d recommend looking at a fast-growing restaurant franchise with an A+ ranch dressing sauce.
Stocks We Would Buy Instead of Red Robin
Donald Trump’s April 2025 "Liberation Day" tariffs sent markets into a tailspin, but stocks have since rebounded strongly, proving that knee-jerk reactions often create the best buying opportunities.
The smart money is already positioning for the next leg up. Don’t miss out on the recovery - check out our Top 5 Growth Stocks for this month. This is a curated list of our High Quality stocks that have generated a market-beating return of 183% over the last five years (as of March 31st 2025).
Stocks that made our list in 2020 include now familiar names such as Nvidia (+1,545% between March 2020 and March 2025) as well as under-the-radar businesses like the once-small-cap company Exlservice (+354% five-year return). Find your next big winner with StockStory today.
StockStory is growing and hiring equity analyst and marketing roles. Are you a 0 to 1 builder passionate about the markets and AI? See the open roles here.