Even though Olaplex (currently trading at $1.31 per share) has gained 22.4% over the last six months, it has lagged the S&P 500’s 32.7% return during that period. This may have investors wondering how to approach the situation.
Is there a buying opportunity in Olaplex, or does it present a risk to your portfolio? See what our analysts have to say in our full research report, it’s free for active Edge members.
Why Is Olaplex Not Exciting?
We don't have much confidence in Olaplex. Here are three reasons you should be careful with OLPX and a stock we'd rather own.
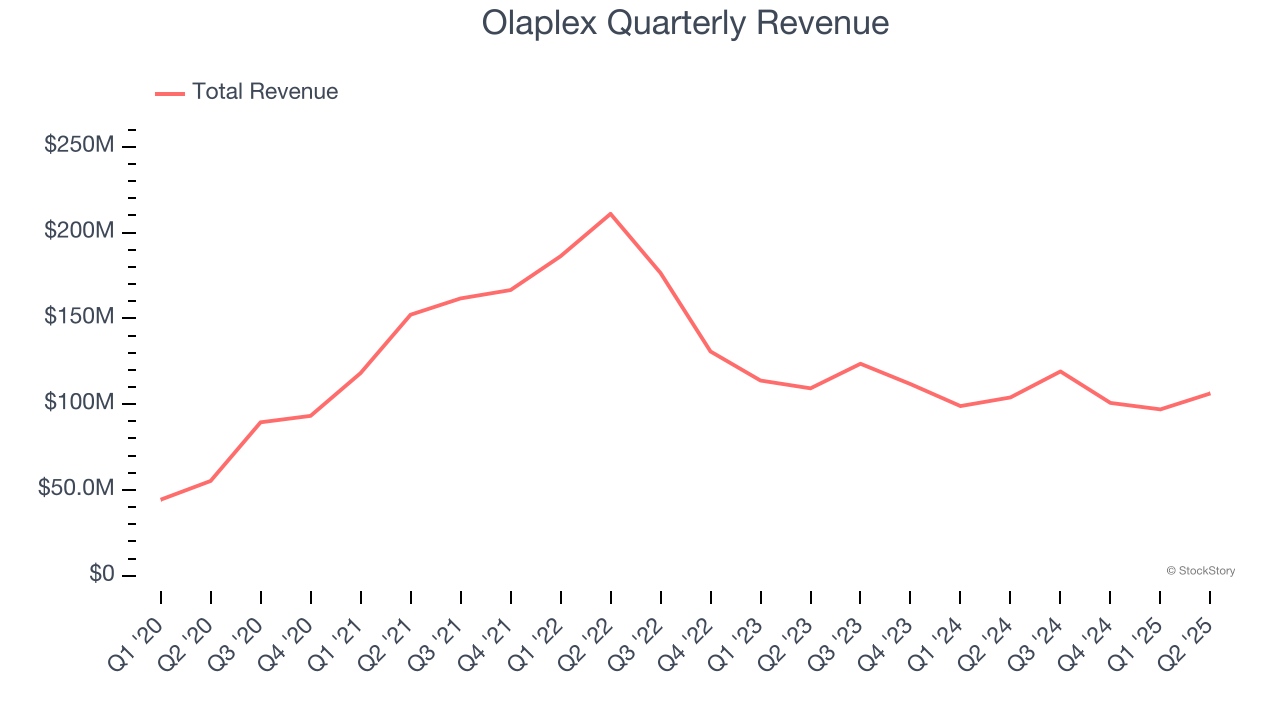
1. Revenue Spiraling Downwards
Reviewing a company’s long-term sales performance reveals insights into its quality. Any business can have short-term success, but a top-tier one grows for years. Olaplex struggled to consistently generate demand over the last three years as its sales dropped at a 16.4% annual rate. This wasn’t a great result and signals it’s a lower quality business.
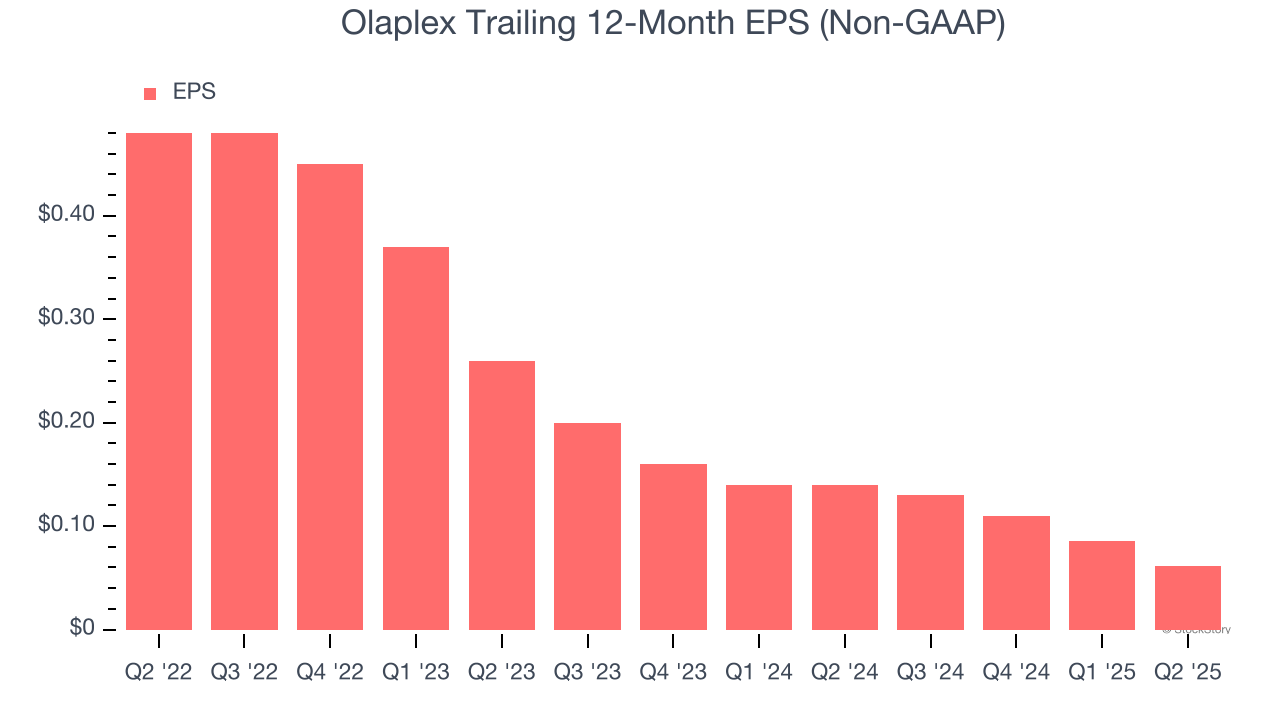
2. EPS Trending Down
We track the change in earnings per share (EPS) because it highlights whether a company’s growth is profitable.
Sadly for Olaplex, its EPS declined by 49.6% annually over the last three years, more than its revenue. This tells us the company struggled because its fixed cost base made it difficult to adjust to shrinking demand.
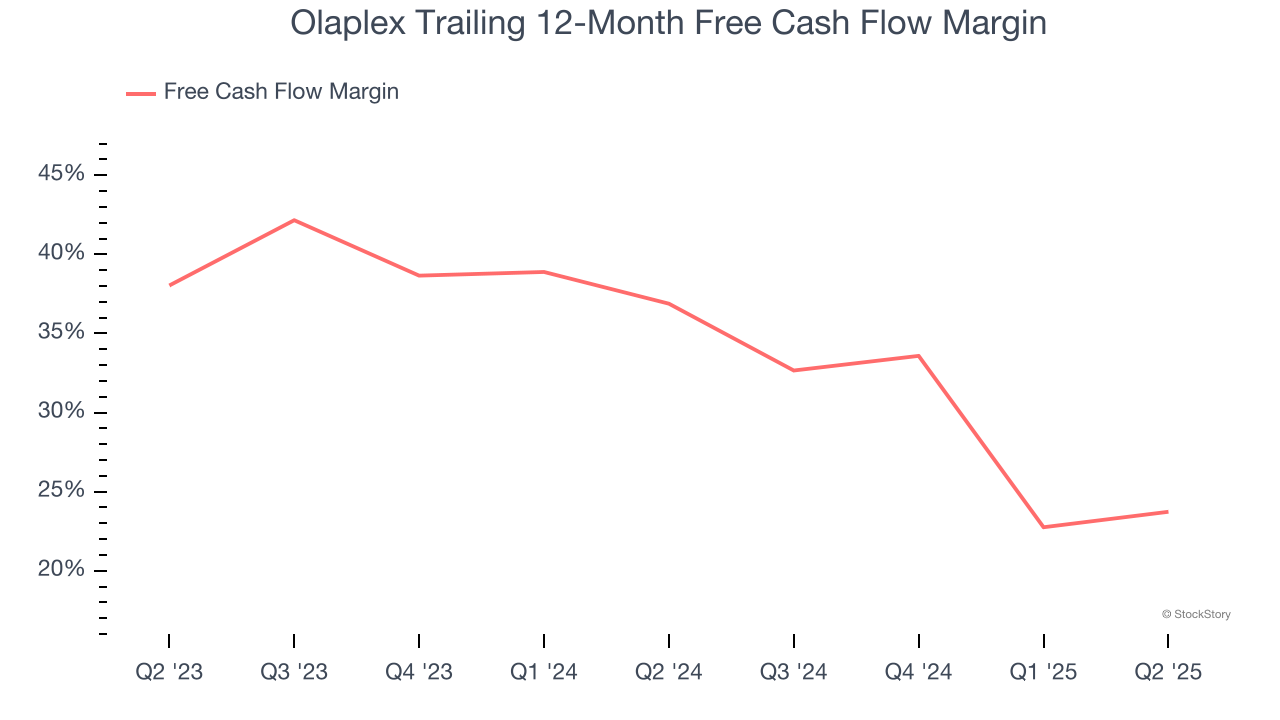
3. Free Cash Flow Margin Dropping
If you’ve followed StockStory for a while, you know we emphasize free cash flow. Why, you ask? We believe that in the end, cash is king, and you can’t use accounting profits to pay the bills.
As you can see below, Olaplex’s margin dropped by 13.2 percentage points over the last year. If its declines continue, it could signal increasing investment needs and capital intensity. Olaplex’s free cash flow margin for the trailing 12 months was 23.7%.
Final Judgment
Olaplex isn’t a terrible business, but it doesn’t pass our bar. With its shares trailing the market in recent months, the stock trades at 16.6× forward P/E (or $1.31 per share). This valuation multiple is fair, but we don’t have much faith in the company. We're fairly confident there are better investments elsewhere. We’d recommend looking at one of Charlie Munger’s all-time favorite businesses.
Stocks We Like More Than Olaplex
When Trump unveiled his aggressive tariff plan in April 2025, markets tanked as investors feared a full-blown trade war. But those who panicked and sold missed the subsequent rebound that’s already erased most losses.
Don’t let fear keep you from great opportunities and take a look at Top 9 Market-Beating Stocks. This is a curated list of our High Quality stocks that have generated a market-beating return of 183% over the last five years (as of March 31st 2025).
Stocks that made our list in 2020 include now familiar names such as Nvidia (+1,545% between March 2020 and March 2025) as well as under-the-radar businesses like the once-small-cap company Comfort Systems (+782% five-year return). Find your next big winner with StockStory today.
StockStory is growing and hiring equity analyst and marketing roles. Are you a 0 to 1 builder passionate about the markets and AI? See the open roles here.