While the S&P 500 is up 32.7% since April 2025, Ziff Davis (currently trading at $39 per share) has lagged behind, posting a return of 20.1%. This may have investors wondering how to approach the situation.
Is there a buying opportunity in Ziff Davis, or does it present a risk to your portfolio? Get the full stock story straight from our expert analysts, it’s free for active Edge members.
Why Do We Think Ziff Davis Will Underperform?
We're cautious about Ziff Davis. Here are three reasons there are better opportunities than ZD and a stock we'd rather own.
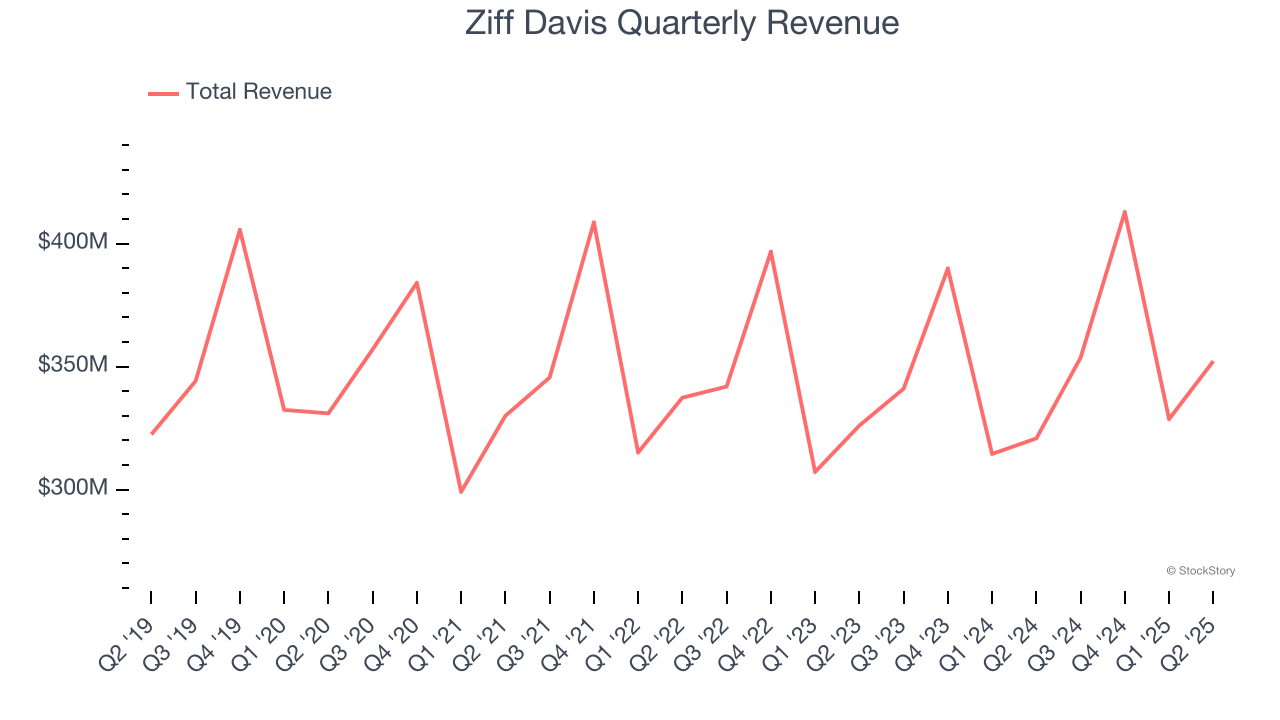
1. Long-Term Revenue Growth Flatter Than a Pancake
A company’s long-term sales performance is one signal of its overall quality. Any business can put up a good quarter or two, but the best consistently grow over the long haul. Unfortunately, Ziff Davis struggled to consistently increase demand as its $1.45 billion of sales for the trailing 12 months was close to its revenue five years ago. This wasn’t a great result and signals it’s a low quality business.
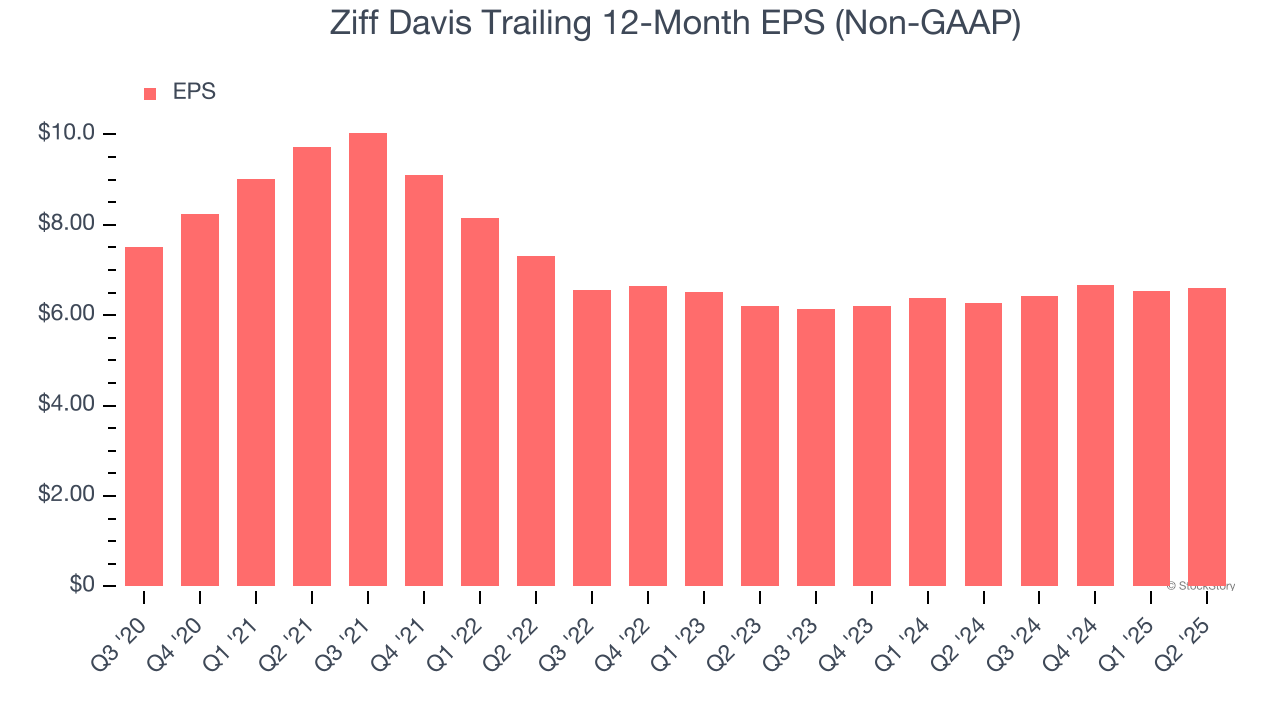
2. EPS Trending Down
Analyzing the long-term change in earnings per share (EPS) shows whether a company's incremental sales were profitable – for example, revenue could be inflated through excessive spending on advertising and promotions.
Sadly for Ziff Davis, its EPS declined by 2% annually over the last five years while its revenue was flat. This tells us the company struggled because its fixed cost base made it difficult to adjust to choppy demand.
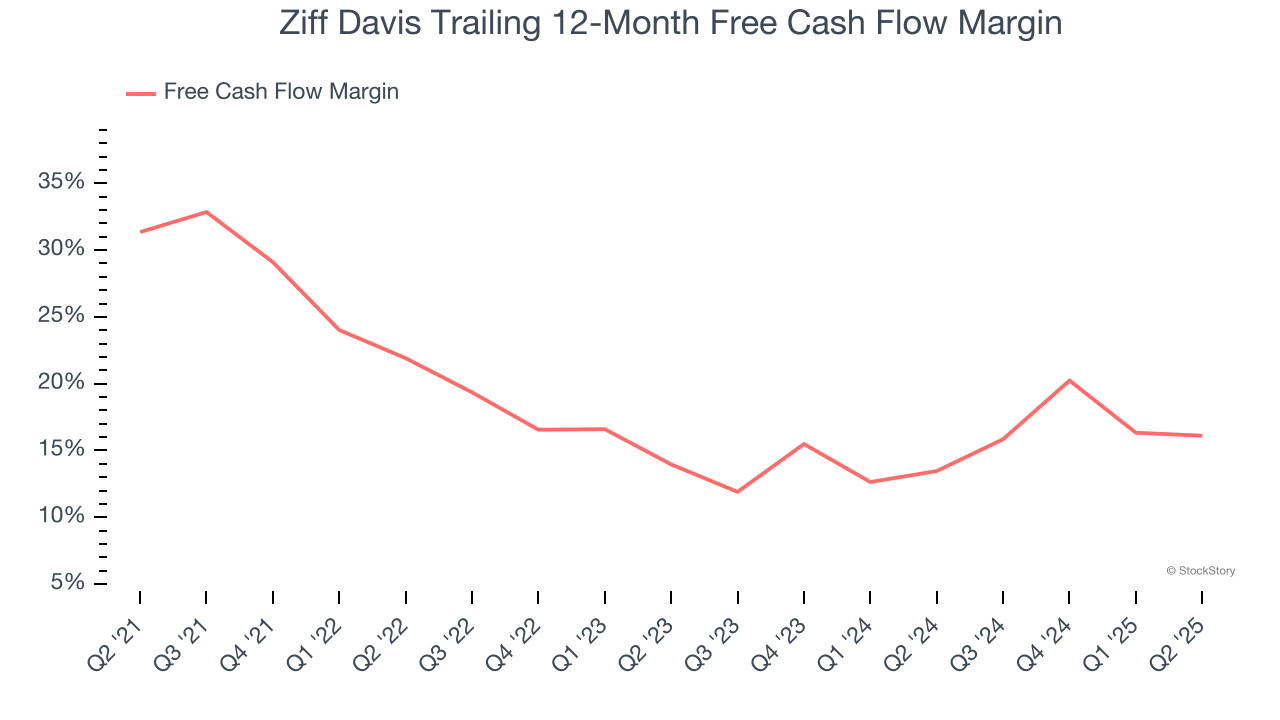
3. Free Cash Flow Margin Dropping
Free cash flow isn't a prominently featured metric in company financials and earnings releases, but we think it's telling because it accounts for all operating and capital expenses, making it tough to manipulate. Cash is king.
As you can see below, Ziff Davis’s margin dropped by 15.2 percentage points over the last five years. It may have ticked higher more recently, but shareholders are likely hoping for its margin to at least revert to its historical level. If the longer-term trend returns, it could signal increasing investment needs and capital intensity. Ziff Davis’s free cash flow margin for the trailing 12 months was 16.1%.
Final Judgment
We see the value of companies helping their customers, but in the case of Ziff Davis, we’re out. With its shares underperforming the market lately, the stock trades at 5.7× forward P/E (or $39 per share). While this valuation is optically cheap, the potential downside is huge given its shaky fundamentals. There are better stocks to buy right now. We’d suggest looking at one of our top digital advertising picks.
High-Quality Stocks for All Market Conditions
When Trump unveiled his aggressive tariff plan in April 2025, markets tanked as investors feared a full-blown trade war. But those who panicked and sold missed the subsequent rebound that’s already erased most losses.
Don’t let fear keep you from great opportunities and take a look at Top 9 Market-Beating Stocks. This is a curated list of our High Quality stocks that have generated a market-beating return of 183% over the last five years (as of March 31st 2025).
Stocks that made our list in 2020 include now familiar names such as Nvidia (+1,545% between March 2020 and March 2025) as well as under-the-radar businesses like the once-small-cap company Comfort Systems (+782% five-year return). Find your next big winner with StockStory today.
StockStory is growing and hiring equity analyst and marketing roles. Are you a 0 to 1 builder passionate about the markets and AI? See the open roles here.