What a brutal six months it’s been for BellRing Brands. The stock has dropped 49.1% and now trades at $35.68, rattling many shareholders. This may have investors wondering how to approach the situation.
Following the pullback, is this a buying opportunity for BRBR? Find out in our full research report, it’s free for active Edge members.
Why Are We Positive On BRBR?
Spun out of Post Holdings in 2019, Bellring Brands (NYSE: BRBR) offers protein shakes, nutrition bars, and other products under the PowerBar, Premier Protein, and Dymatize brands.
1. Elevated Demand Drives Higher Sales Volumes
Revenue growth can be broken down into changes in price and volume (the number of units sold). While both are important, volume is the lifeblood of a successful staples business as there’s a ceiling to what consumers will pay for everyday goods; they can always trade down to non-branded products if the branded versions are too expensive.
BellRing Brands’s average quarterly volume growth of 20.1% over the last two years has beaten the competition by a long shot. This is great because companies with significant volume growth are needles in a haystack in the stable consumer staples sector. 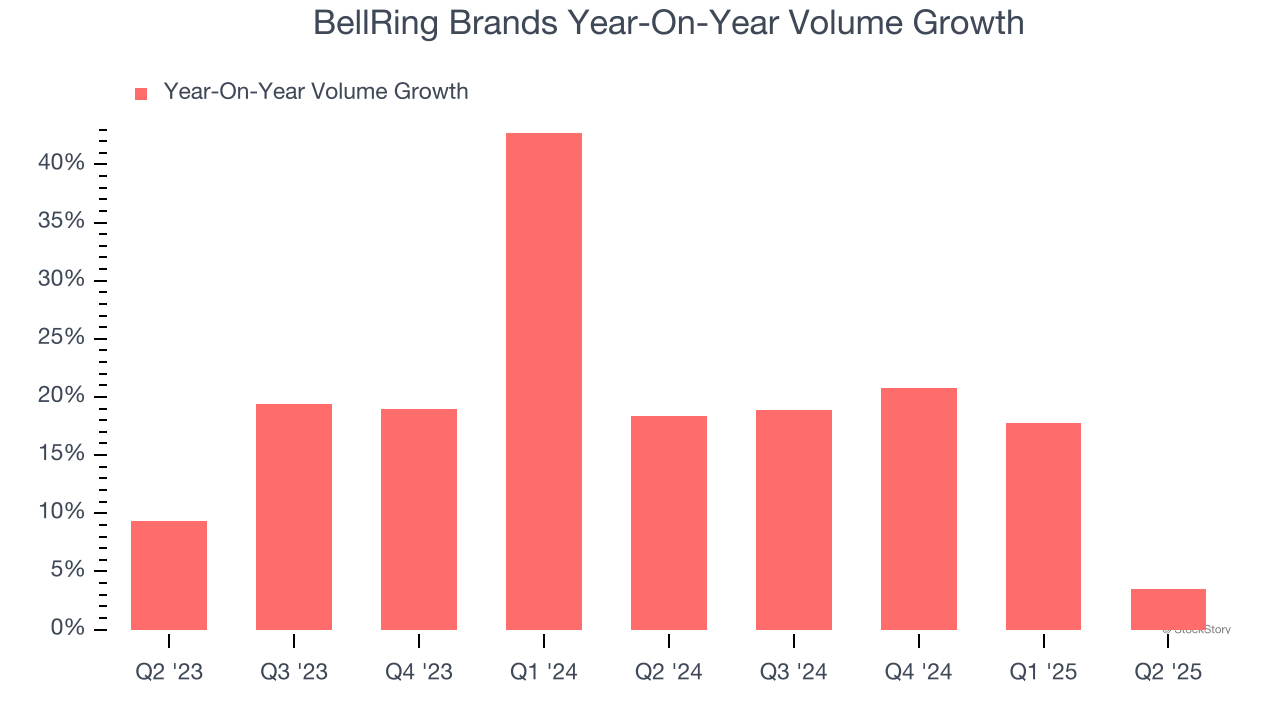
2. Outstanding Long-Term EPS Growth
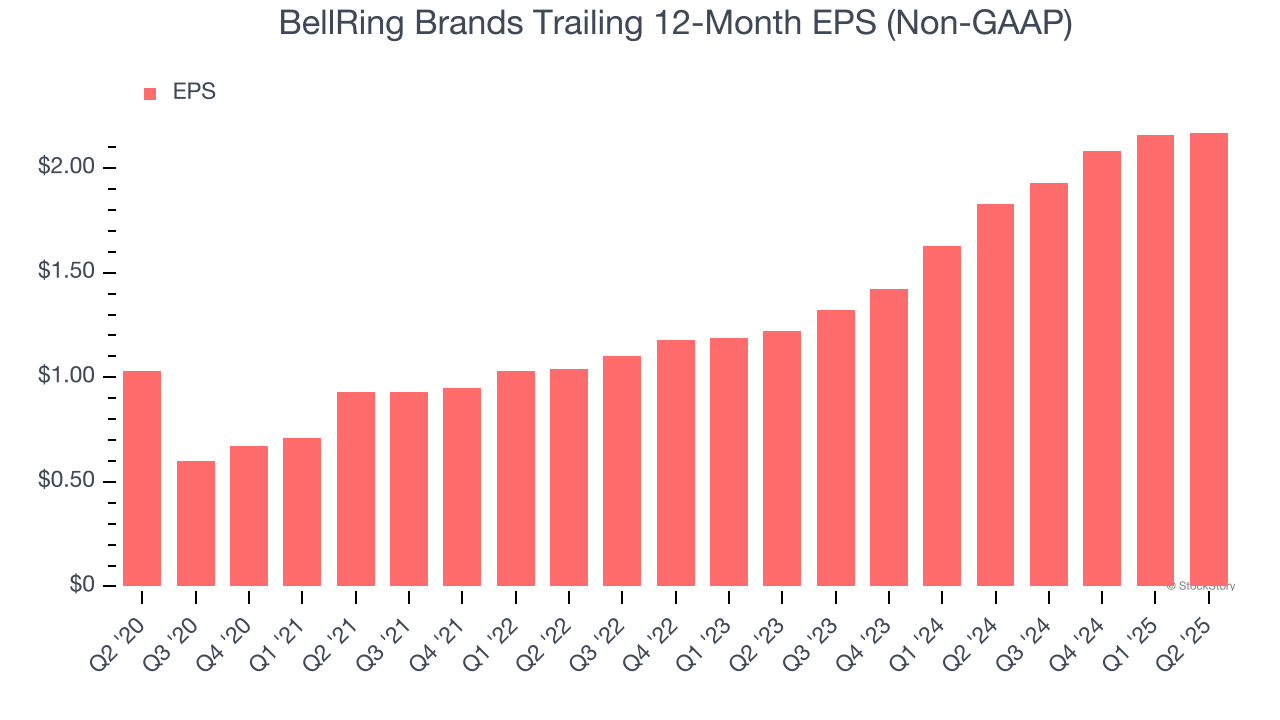
Analyzing the change in earnings per share (EPS) shows whether a company's incremental sales were profitable – for example, revenue could be inflated through excessive spending on advertising and promotions.
BellRing Brands’s EPS grew at an astounding 27.8% compounded annual growth rate over the last three years, higher than its 18.6% annualized revenue growth. This tells us the company became more profitable on a per-share basis as it expanded.
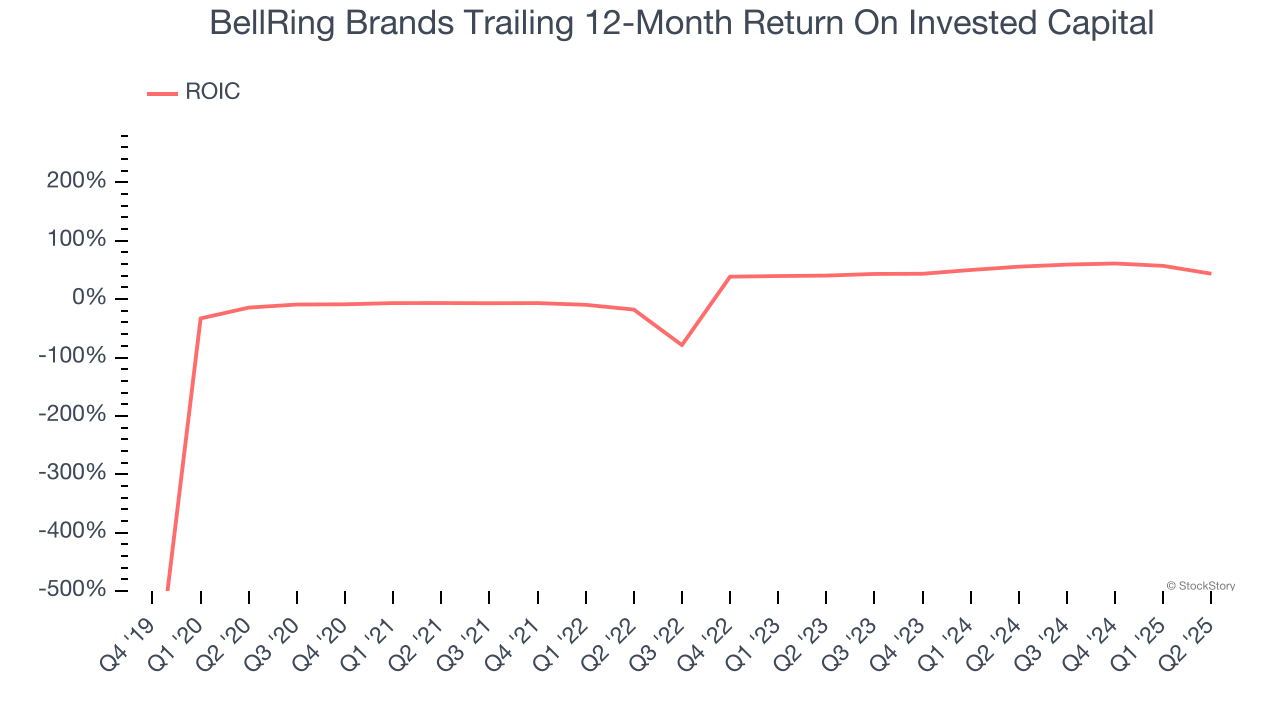
3. Stellar ROIC Showcases Lucrative Growth Opportunities
Growth gives us insight into a company’s long-term potential, but how capital-efficient was that growth? A company’s ROIC explains this by showing how much operating profit it makes compared to the money it has raised (debt and equity).
BellRing Brands’s five-year average ROIC was 46.6%, placing it among the best consumer staples companies. This illustrates its management team’s ability to invest in highly profitable ventures and produce tangible results for shareholders.
Final Judgment
These are just a few reasons why BellRing Brands ranks highly on our list. With the recent decline, the stock trades at 14.5× forward P/E (or $35.68 per share). Is now the time to initiate a position? See for yourself in our full research report, it’s free for active Edge members.
Stocks We Like Even More Than BellRing Brands
Donald Trump’s April 2025 "Liberation Day" tariffs sent markets into a tailspin, but stocks have since rebounded strongly, proving that knee-jerk reactions often create the best buying opportunities.
The smart money is already positioning for the next leg up. Don’t miss out on the recovery - check out our Top 6 Stocks for this week. This is a curated list of our High Quality stocks that have generated a market-beating return of 183% over the last five years (as of March 31st 2025).
Stocks that made our list in 2020 include now familiar names such as Nvidia (+1,545% between March 2020 and March 2025) as well as under-the-radar businesses like the once-micro-cap company Tecnoglass (+1,754% five-year return). Find your next big winner with StockStory today.
StockStory is growing and hiring equity analyst and marketing roles. Are you a 0 to 1 builder passionate about the markets and AI? See the open roles here.