
Although Tri Pointe Homes (currently trading at $34.65 per share) has gained 14.7% over the last six months, it has trailed the S&P 500’s 32.7% return during that period. This might have investors contemplating their next move.
Is there a buying opportunity in Tri Pointe Homes, or does it present a risk to your portfolio? Get the full breakdown from our expert analysts, it’s free for active Edge members.
Why Do We Think Tri Pointe Homes Will Underperform?
We're swiping left on Tri Pointe Homes for now. Here are three reasons we avoid TPH and a stock we'd rather own.
1. Backlog Declines as Orders Drop
Investors interested in Home Builders companies should track backlog in addition to reported revenue. This metric shows the value of outstanding orders that have not yet been executed or delivered, giving visibility into Tri Pointe Homes’s future revenue streams.
Tri Pointe Homes’s backlog came in at $1.18 billion in the latest quarter, and it averaged 7.6% year-on-year declines over the last two years. This performance was underwhelming and shows the company is not winning new orders. It also suggests there may be increasing competition or market saturation. 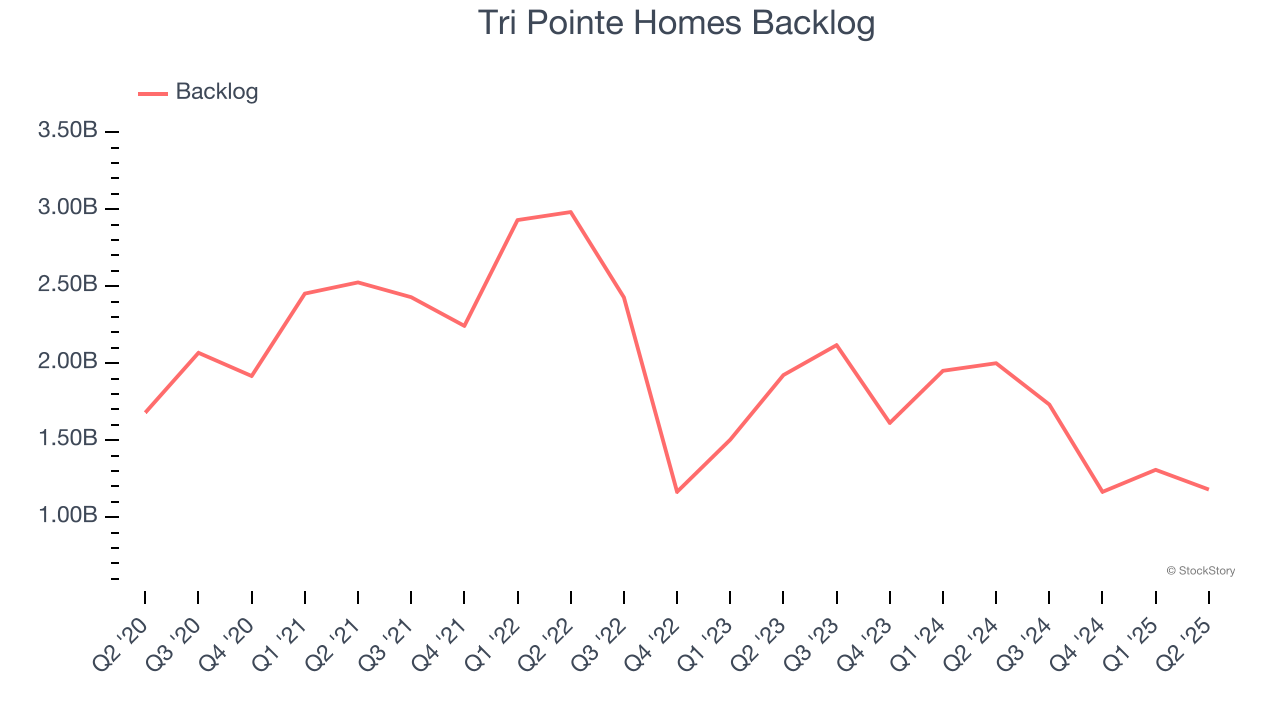
2. Revenue Projections Show Stormy Skies Ahead
Forecasted revenues by Wall Street analysts signal a company’s potential. Predictions may not always be accurate, but accelerating growth typically boosts valuation multiples and stock prices while slowing growth does the opposite.
Over the next 12 months, sell-side analysts expect Tri Pointe Homes’s revenue to drop by 18.5%, a decrease from its 4.4% annualized growth for the past five years. This projection is underwhelming and suggests its products and services will see some demand headwinds.
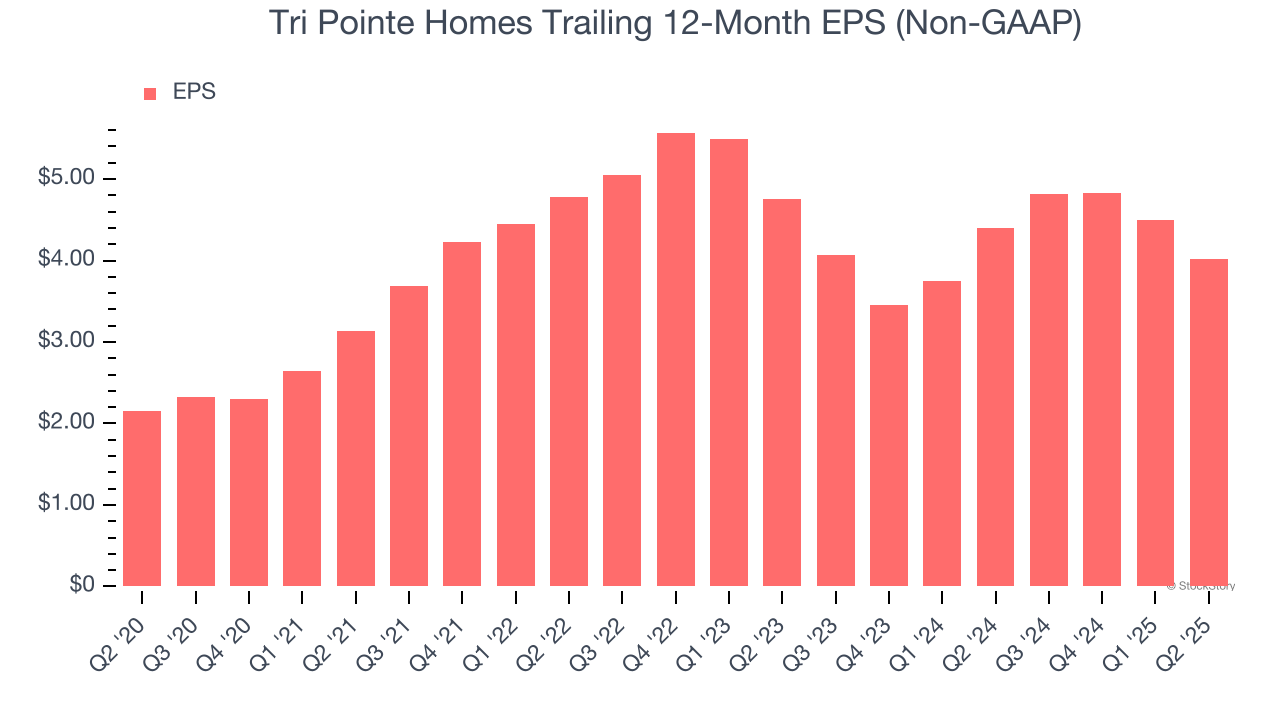
3. EPS Took a Dip Over the Last Two Years
While long-term earnings trends give us the big picture, we also track EPS over a shorter period because it can provide insight into an emerging theme or development for the business.
Sadly for Tri Pointe Homes, its EPS declined by more than its revenue over the last two years, dropping 8.1%. This tells us the company struggled to adjust to shrinking demand.
Final Judgment
Tri Pointe Homes falls short of our quality standards. With its shares underperforming the market lately, the stock trades at 12.3× forward P/E (or $34.65 per share). This valuation is reasonable, but the company’s shaky fundamentals present too much downside risk. There are more exciting stocks to buy at the moment. We’d recommend looking at the most entrenched endpoint security platform on the market.
Stocks We Would Buy Instead of Tri Pointe Homes
Trump’s April 2025 tariff bombshell triggered a massive market selloff, but stocks have since staged an impressive recovery, leaving those who panic sold on the sidelines.
Take advantage of the rebound by checking out our Top 5 Growth Stocks for this month. This is a curated list of our High Quality stocks that have generated a market-beating return of 183% over the last five years (as of March 31st 2025).
Stocks that made our list in 2020 include now familiar names such as Nvidia (+1,545% between March 2020 and March 2025) as well as under-the-radar businesses like the once-small-cap company Exlservice (+354% five-year return). Find your next big winner with StockStory today.
StockStory is growing and hiring equity analyst and marketing roles. Are you a 0 to 1 builder passionate about the markets and AI? See the open roles here.