
Although Radian Group (currently trading at $34.74 per share) has gained 13.4% over the last six months, it has trailed the S&P 500’s 33.2% return during that period. This was partly due to its softer quarterly results and might have investors contemplating their next move.
Is now the time to buy Radian Group, or should you be careful about including it in your portfolio? See what our analysts have to say in our full research report, it’s free for active Edge members.
Why Is Radian Group Not Exciting?
We're swiping left on Radian Group for now. Here are three reasons we avoid RDN and a stock we'd rather own.
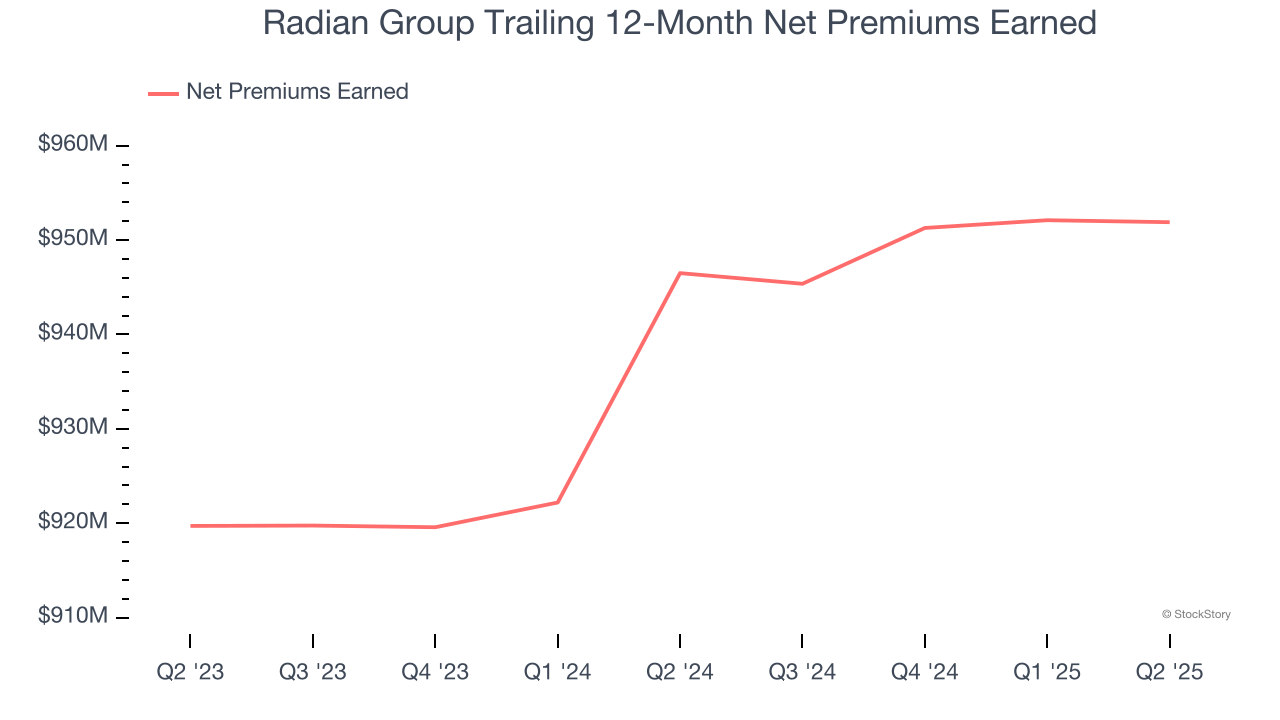
1. Declining Net Premiums Earned Reflect Weakness
Insurers sell policies then use reinsurance (insurance for insurance companies) to protect themselves from large losses. Net premiums earned are therefore what's collected from selling policies less what’s paid to reinsurers as a risk mitigation tool.
Radian Group’s net premiums earned has declined by 3% annually over the last five years, much worse than the broader insurance industry and in line with its total revenue.
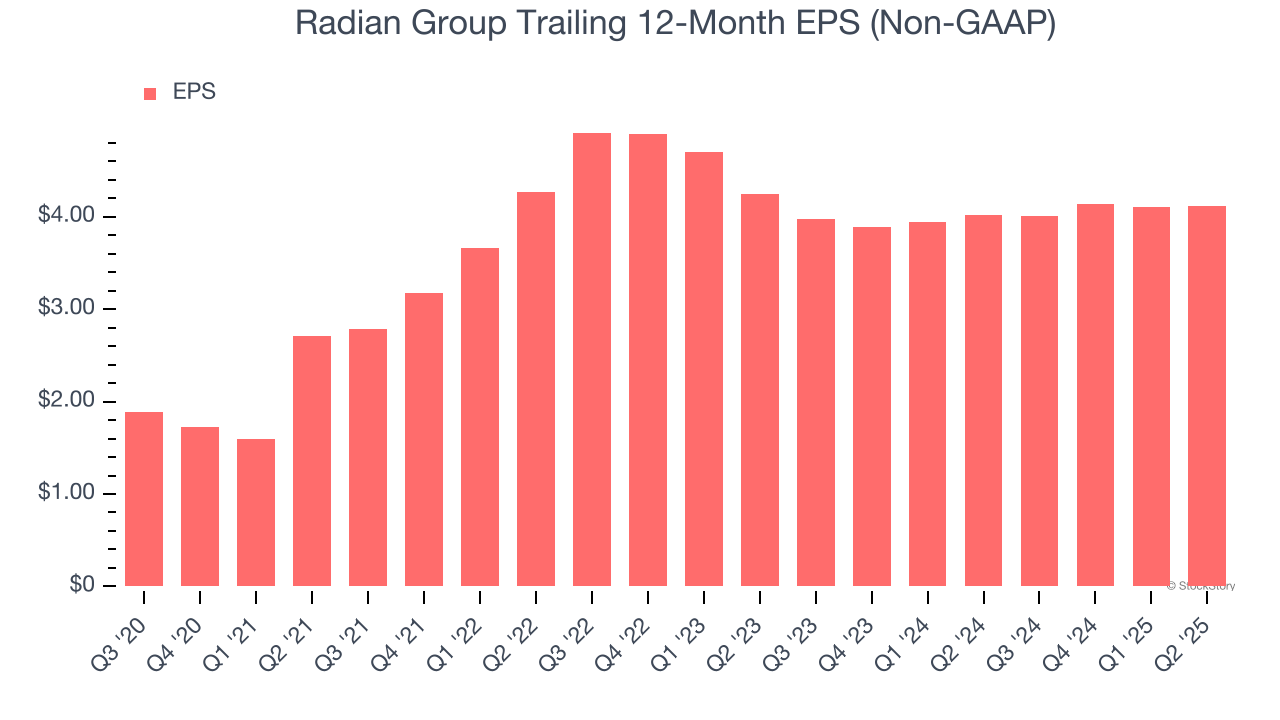
3. EPS Took a Dip Over the Last Two Years
Although long-term earnings trends give us the big picture, we like to analyze EPS over a shorter period to see if we are missing a change in the business.
Sadly for Radian Group, its EPS declined by 1.5% annually over the last two years while its revenue grew by 3.1%. This tells us the company became less profitable on a per-share basis as it expanded.
Final Judgment
Radian Group isn’t a terrible business, but it doesn’t pass our quality test. With its shares underperforming the market lately, the stock trades at 1× forward P/B (or $34.74 per share). While this valuation is fair, the upside isn’t great compared to the potential downside. We're fairly confident there are better investments elsewhere. We’d recommend looking at one of our all-time favorite software stocks.
Stocks We Like More Than Radian Group
Trump’s April 2025 tariff bombshell triggered a massive market selloff, but stocks have since staged an impressive recovery, leaving those who panic sold on the sidelines.
Take advantage of the rebound by checking out our Top 5 Strong Momentum Stocks for this week. This is a curated list of our High Quality stocks that have generated a market-beating return of 183% over the last five years (as of March 31st 2025).
Stocks that made our list in 2020 include now familiar names such as Nvidia (+1,545% between March 2020 and March 2025) as well as under-the-radar businesses like the once-small-cap company Comfort Systems (+782% five-year return). Find your next big winner with StockStory today.
StockStory is growing and hiring equity analyst and marketing roles. Are you a 0 to 1 builder passionate about the markets and AI? See the open roles here.


