Since April 2025, Adobe has been in a holding pattern, posting a small return of 2.7% while floating around $349.87. The stock also fell short of the S&P 500’s 33.2% gain during that period.
Is now the time to buy Adobe, or should you be careful about including it in your portfolio? Get the full breakdown from our expert analysts, it’s free for active Edge members.
Why Is Adobe Not Exciting?
We're swiping left on Adobe for now. Here are three reasons there are better opportunities than ADBE and a stock we'd rather own.
1. Weak Billings Point to Soft Demand
Billings is a non-GAAP metric that is often called “cash revenue” because it shows how much money the company has collected from customers in a certain period. This is different from revenue, which must be recognized in pieces over the length of a contract.
Adobe’s billings came in at $6.19 billion in Q3, and over the last four quarters, its year-on-year growth averaged 11.6%. This performance was underwhelming and suggests that increasing competition is causing challenges in acquiring/retaining customers. 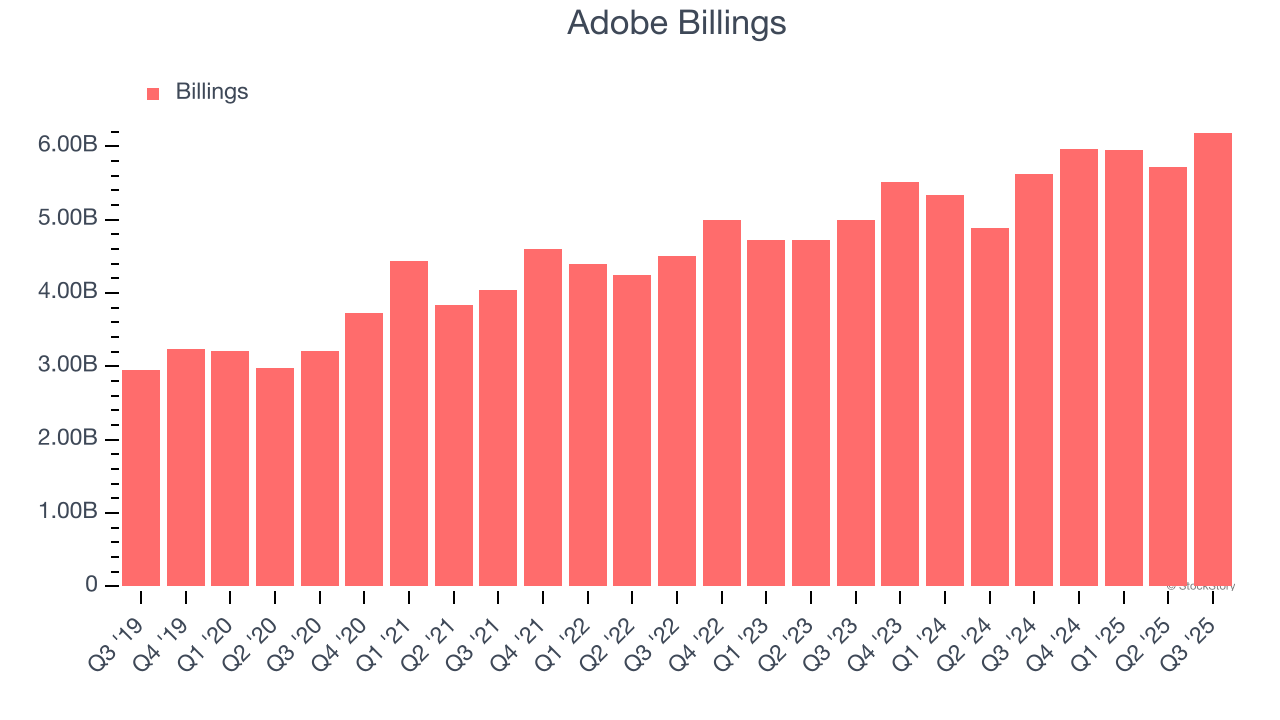
2. Projected Revenue Growth Is Slim
Forecasted revenues by Wall Street analysts signal a company’s potential. Predictions may not always be accurate, but accelerating growth typically boosts valuation multiples and stock prices while slowing growth does the opposite.
Over the next 12 months, sell-side analysts expect Adobe’s revenue to rise by 9%, a slight deceleration versus its 13.3% annualized growth for the past five years. This projection doesn't excite us and suggests its products and services will see some demand headwinds.
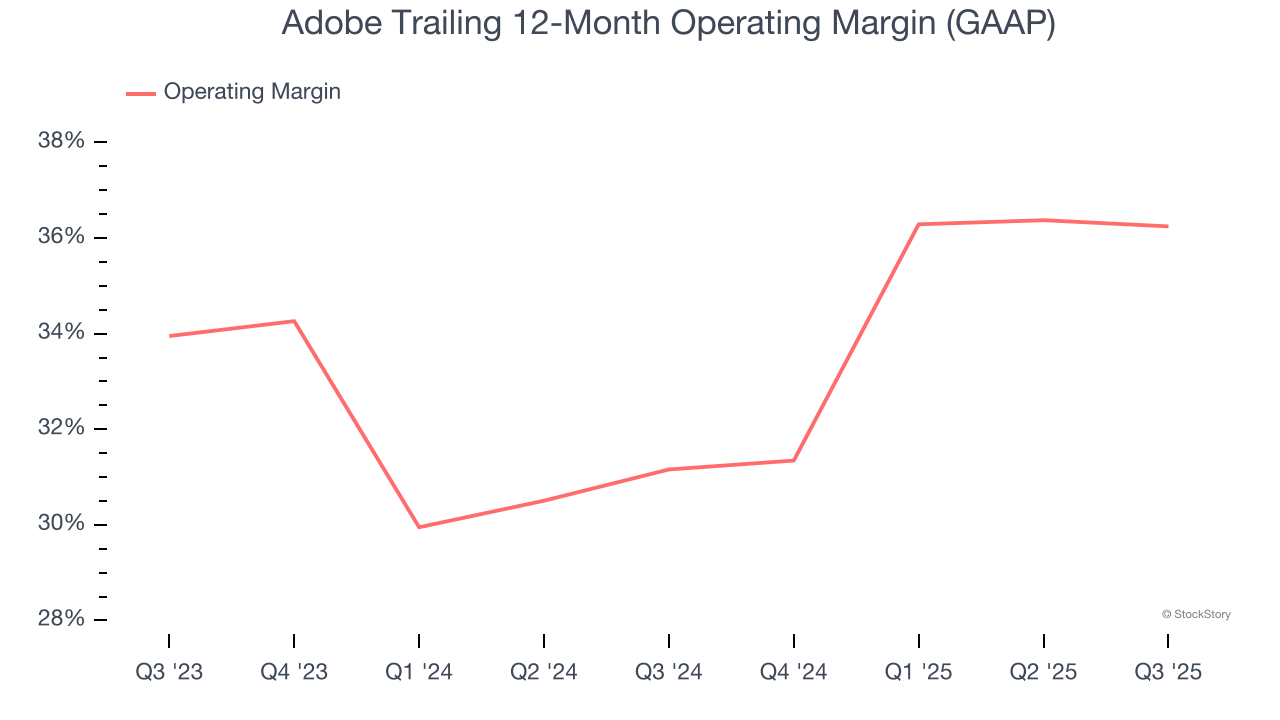
3. Operating Margin Rising, Profits Up
Many software businesses adjust their profits for stock-based compensation (SBC), but we prioritize GAAP operating margin because SBC is a real expense used to attract and retain engineering and sales talent. This metric shows how much revenue remains after accounting for all core expenses – everything from the cost of goods sold to sales and R&D.
Analyzing the trend in its profitability, Adobe’s operating margin rose by 5.1 percentage points over the last two years, as its sales growth gave it operating leverage. Its operating margin for the trailing 12 months was 36.2%.
Final Judgment
Adobe isn’t a terrible business, but it doesn’t pass our quality test. With its shares trailing the market in recent months, the stock trades at 5.9× forward price-to-sales (or $349.87 per share). This valuation is reasonable, but the company’s shakier fundamentals present too much downside risk. We're pretty confident there are superior stocks to buy right now. We’d suggest looking at one of our top digital advertising picks.
High-Quality Stocks for All Market Conditions
Trump’s April 2025 tariff bombshell triggered a massive market selloff, but stocks have since staged an impressive recovery, leaving those who panic sold on the sidelines.
Take advantage of the rebound by checking out our Top 6 Stocks for this week. This is a curated list of our High Quality stocks that have generated a market-beating return of 183% over the last five years (as of March 31st 2025).
Stocks that made our list in 2020 include now familiar names such as Nvidia (+1,545% between March 2020 and March 2025) as well as under-the-radar businesses like the once-micro-cap company Tecnoglass (+1,754% five-year return). Find your next big winner with StockStory today.
StockStory is growing and hiring equity analyst and marketing roles. Are you a 0 to 1 builder passionate about the markets and AI? See the open roles here.