
Even though Bloomin' Brands (currently trading at $7.50 per share) has gained 16.5% over the last six months, it has lagged the S&P 500’s 33.2% return during that period. This was partly due to its softer quarterly results and might have investors contemplating their next move.
Is now the time to buy Bloomin' Brands, or should you be careful about including it in your portfolio? Get the full stock story straight from our expert analysts, it’s free for active Edge members.
Why Do We Think Bloomin' Brands Will Underperform?
We're swiping left on Bloomin' Brands for now. Here are three reasons there are better opportunities than BLMN and a stock we'd rather own.
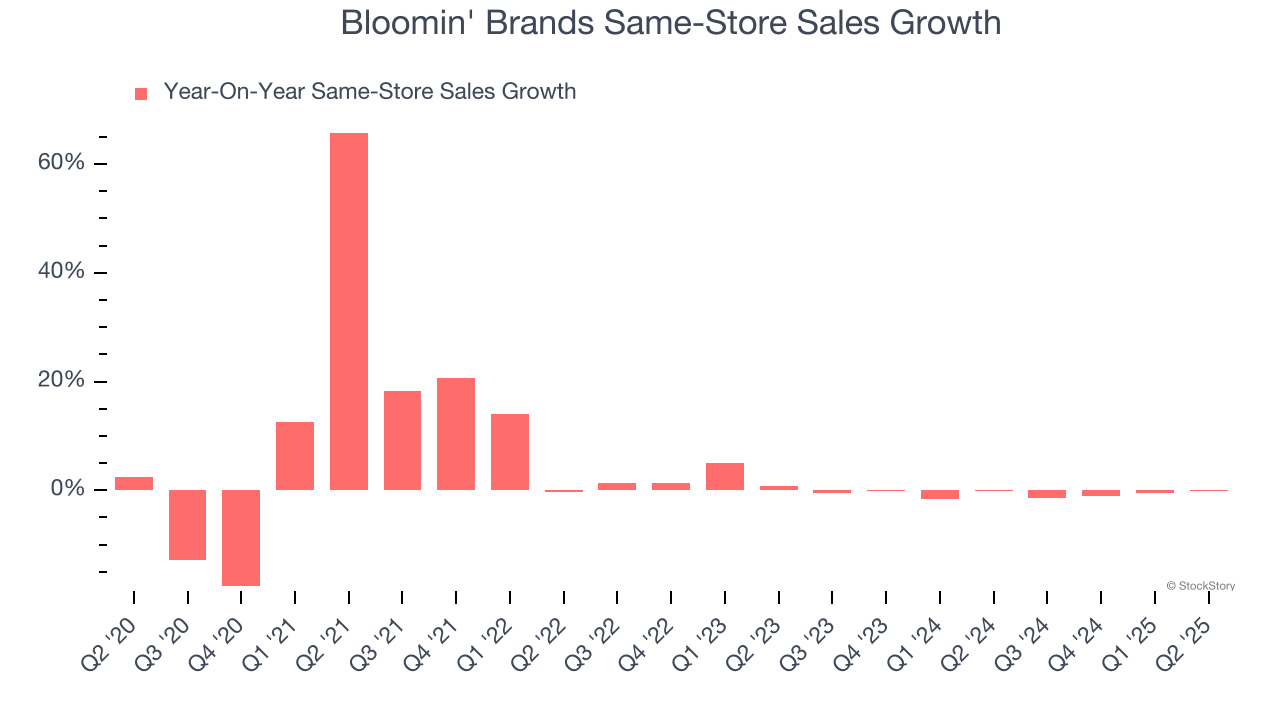
1. Flat Same-Store Sales Indicate Weak Demand
Same-store sales is a key performance indicator used to measure organic growth at restaurants open for at least a year.
Bloomin' Brands’s demand within its existing dining locations has barely increased over the last two years as its same-store sales were flat.
2. Revenue Projections Show Stormy Skies Ahead
Forecasted revenues by Wall Street analysts signal a company’s potential. Predictions may not always be accurate, but accelerating growth typically boosts valuation multiples and stock prices while slowing growth does the opposite.
Over the next 12 months, sell-side analysts expect Bloomin' Brands’s revenue to drop by 2.4%, a decrease from This projection is underwhelming and implies its menu offerings will face some demand challenges.
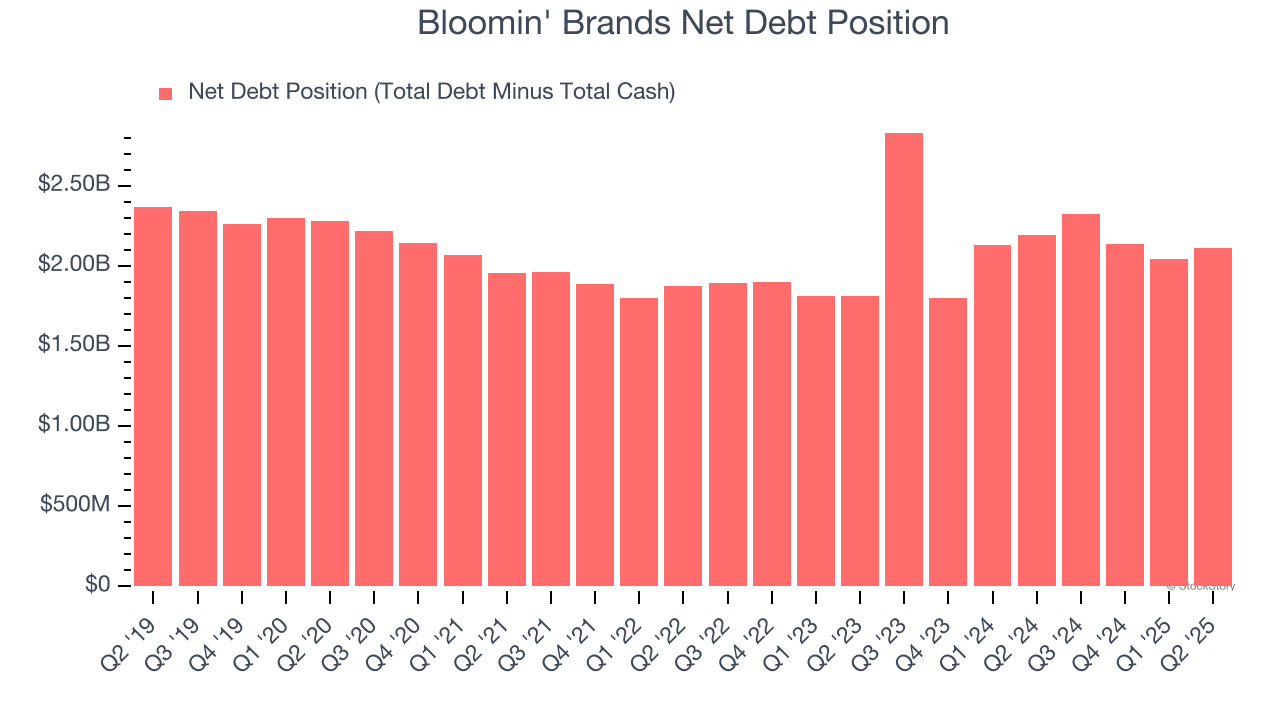
3. High Debt Levels Increase Risk
Debt is a tool that can boost company returns but presents risks if used irresponsibly. As long-term investors, we aim to avoid companies taking excessive advantage of this instrument because it could lead to insolvency.
Bloomin' Brands’s $2.16 billion of debt exceeds the $50.31 million of cash on its balance sheet. Furthermore, its 6× net-debt-to-EBITDA ratio (based on its EBITDA of $347.5 million over the last 12 months) shows the company is overleveraged.
At this level of debt, incremental borrowing becomes increasingly expensive and credit agencies could downgrade the company’s rating if profitability falls. Bloomin' Brands could also be backed into a corner if the market turns unexpectedly – a situation we seek to avoid as investors in high-quality companies.
We hope Bloomin' Brands can improve its balance sheet and remain cautious until it increases its profitability or pays down its debt.
Final Judgment
Bloomin' Brands falls short of our quality standards. With its shares trailing the market in recent months, the stock trades at 5.7× forward P/E (or $7.50 per share). While this valuation is optically cheap, the potential downside is huge given its shaky fundamentals. There are better investments elsewhere. We’d suggest looking at the most dominant software business in the world.
High-Quality Stocks for All Market Conditions
When Trump unveiled his aggressive tariff plan in April 2025, markets tanked as investors feared a full-blown trade war. But those who panicked and sold missed the subsequent rebound that’s already erased most losses.
Don’t let fear keep you from great opportunities and take a look at Top 5 Growth Stocks for this month. This is a curated list of our High Quality stocks that have generated a market-beating return of 183% over the last five years (as of March 31st 2025).
Stocks that made our list in 2020 include now familiar names such as Nvidia (+1,545% between March 2020 and March 2025) as well as under-the-radar businesses like the once-small-cap company Exlservice (+354% five-year return). Find your next big winner with StockStory today.
StockStory is growing and hiring equity analyst and marketing roles. Are you a 0 to 1 builder passionate about the markets and AI? See the open roles here.