What a fantastic six months it’s been for C.H. Robinson Worldwide. Shares of the company have skyrocketed 50.7%, hitting $134.36. This was partly due to its solid quarterly results, and the performance may have investors wondering how to approach the situation.
Is now the time to buy C.H. Robinson Worldwide, or should you be careful about including it in your portfolio? Get the full breakdown from our expert analysts, it’s free for active Edge members.
Why Do We Think C.H. Robinson Worldwide Will Underperform?
We’re happy investors have made money, but we're cautious about C.H. Robinson Worldwide. Here are three reasons why CHRW doesn't excite us and a stock we'd rather own.
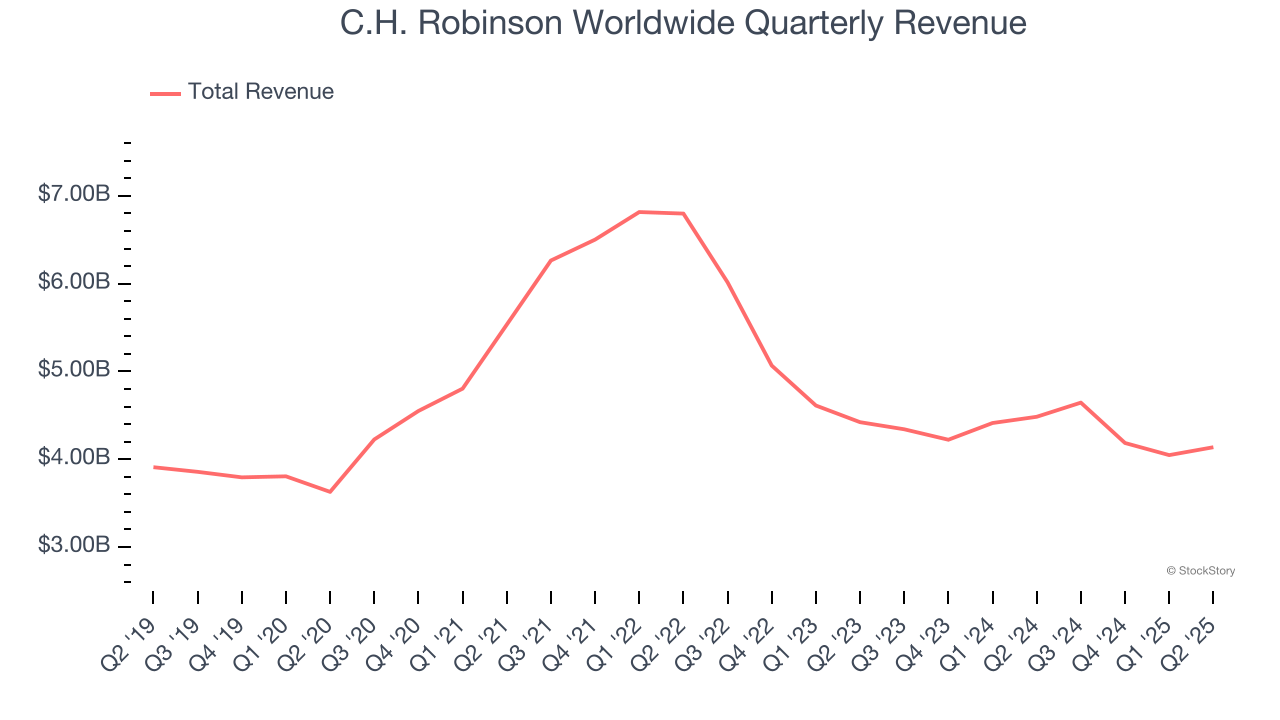
1. Long-Term Revenue Growth Disappoints
Reviewing a company’s long-term sales performance reveals insights into its quality. Any business can have short-term success, but a top-tier one grows for years. Regrettably, C.H. Robinson Worldwide’s sales grew at a sluggish 2.4% compounded annual growth rate over the last five years. This fell short of our benchmarks.
2. Low Gross Margin Reveals Weak Structural Profitability
At StockStory, we prefer high gross margin businesses because they indicate the company has pricing power or differentiated products, giving it a chance to generate higher operating profits.
C.H. Robinson Worldwide has bad unit economics for an industrials business, signaling it operates in a competitive market. As you can see below, it averaged a 7.3% gross margin over the last five years. Said differently, C.H. Robinson Worldwide had to pay a chunky $92.71 to its suppliers for every $100 in revenue. 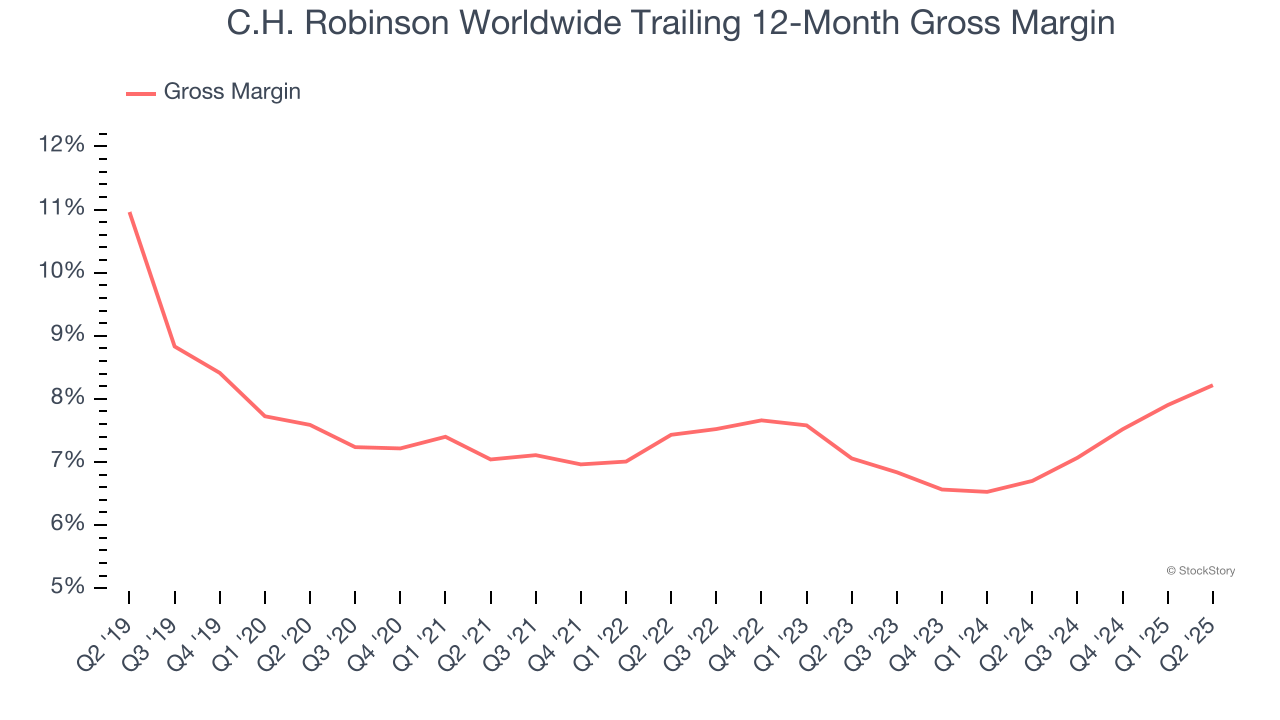
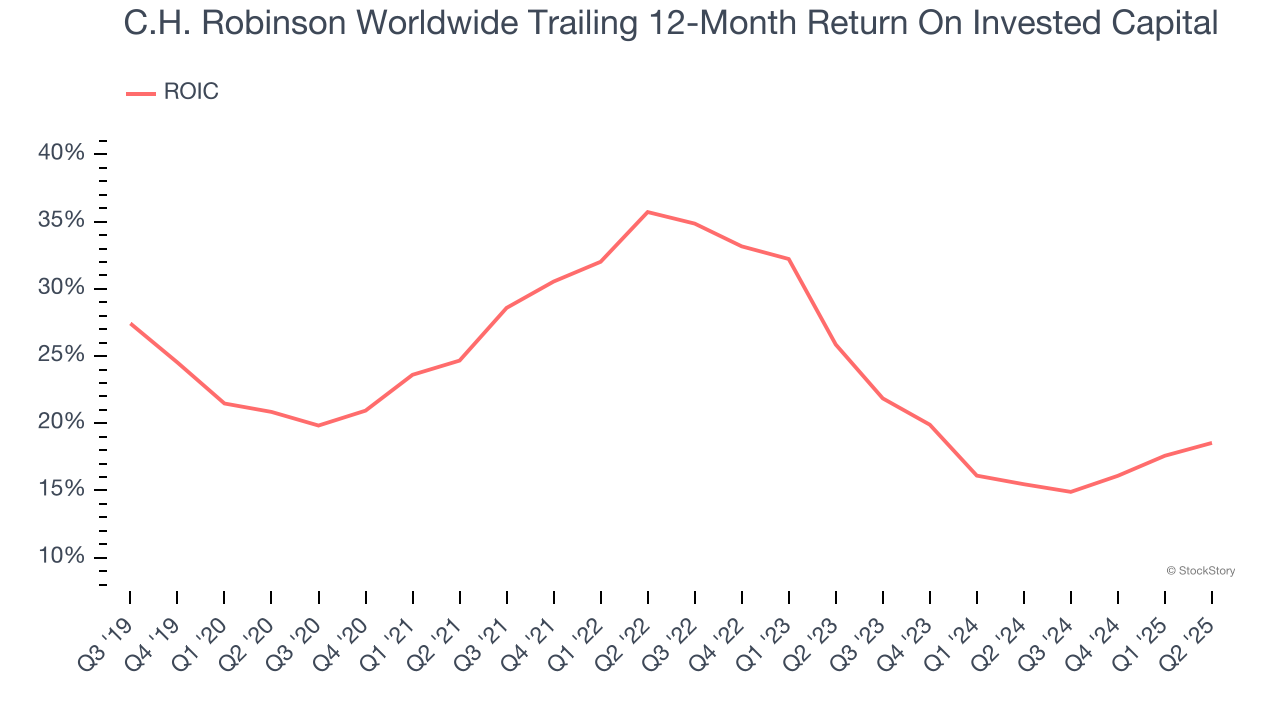
3. New Investments Fail to Bear Fruit as ROIC Declines
ROIC, or return on invested capital, is a metric showing how much operating profit a company generates relative to the money it has raised (debt and equity).
We like to invest in businesses with high returns, but the trend in a company’s ROIC is what often surprises the market and moves the stock price. Unfortunately, C.H. Robinson Worldwide’s ROIC has decreased significantly over the last few years. We like what management has done in the past, but its declining returns are perhaps a symptom of fewer profitable growth opportunities.
Final Judgment
C.H. Robinson Worldwide doesn’t pass our quality test. Following the recent surge, the stock trades at 27.2× forward P/E (or $134.36 per share). This valuation tells us it’s a bit of a market darling with a lot of good news priced in - we think there are better stocks to buy right now. We’d suggest looking at one of our top software and edge computing picks.
Stocks We Like More Than C.H. Robinson Worldwide
Donald Trump’s April 2025 "Liberation Day" tariffs sent markets into a tailspin, but stocks have since rebounded strongly, proving that knee-jerk reactions often create the best buying opportunities.
The smart money is already positioning for the next leg up. Don’t miss out on the recovery - check out our Top 5 Growth Stocks for this month. This is a curated list of our High Quality stocks that have generated a market-beating return of 183% over the last five years (as of March 31st 2025).
Stocks that made our list in 2020 include now familiar names such as Nvidia (+1,545% between March 2020 and March 2025) as well as under-the-radar businesses like the once-small-cap company Exlservice (+354% five-year return). Find your next big winner with StockStory today.
StockStory is growing and hiring equity analyst and marketing roles. Are you a 0 to 1 builder passionate about the markets and AI? See the open roles here.