Semiconductor maker Penguin Solutions (NASDAQ: PENG) missed Wall Street’s revenue expectations in Q3 CY2025, but sales rose 8.6% year on year to $337.9 million. Its non-GAAP profit of $0.37 per share was in line with analysts’ consensus estimates.
Is now the time to buy Penguin Solutions? Find out by accessing our full research report, it’s free for active Edge members.
Penguin Solutions (PENG) Q3 CY2025 Highlights:
- Revenue: $337.9 million vs analyst estimates of $342.5 million (8.6% year-on-year growth, 1.3% miss)
- Adjusted EPS: $0.37 vs analyst estimates of $0.37 (in line)
- Adjusted EBITDA: $43.42 million vs analyst estimates of $41.72 million (12.8% margin, 4.1% beat)
- Adjusted EPS guidance for the upcoming financial year 2026 is $2 at the midpoint, missing analyst estimates by 5.7%
- Operating Margin: 3.7%, in line with the same quarter last year
- Free Cash Flow was -$17.95 million compared to -$17.95 million in the same quarter last year
- Inventory Days Outstanding: 62, down from 73 in the previous quarter
- Market Capitalization: $1.54 billion
"Fiscal 2025 was a year of strong execution and meaningful progress in our transformation from a holding company structure to an enterprise AI infrastructure solutions company," said Mark Adams, CEO of Penguin Solutions.
Company Overview
Based in the US, Penguin Solutions (NASDAQ: PENG) is a diversified semiconductor company offering memory, digital, and LED products.
Revenue Growth
Reviewing a company’s long-term sales performance reveals insights into its quality. Any business can experience short-term success, but top-performing ones enjoy sustained growth for years. Regrettably, Penguin Solutions’s sales grew at a mediocre 4% compounded annual growth rate over the last five years. This was below our standard for the semiconductor sector and is a tough starting point for our analysis. Semiconductors are a cyclical industry, and long-term investors should be prepared for periods of high growth followed by periods of revenue contractions.
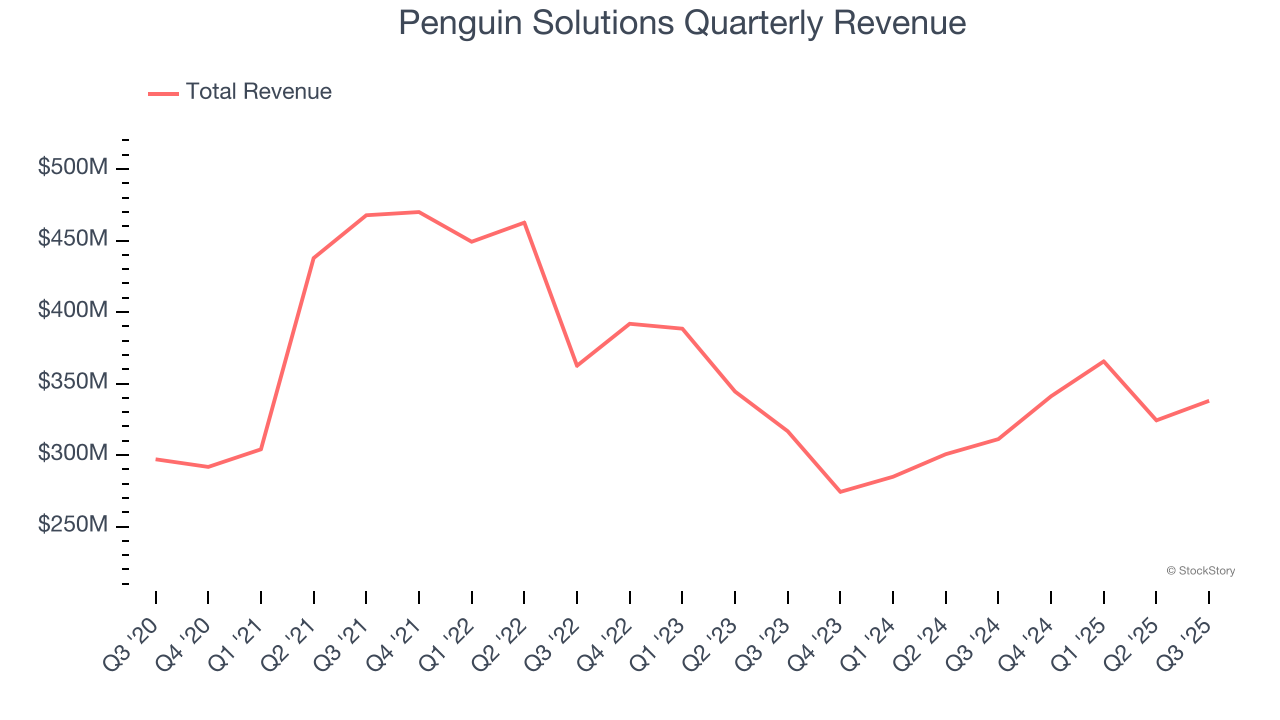
Long-term growth is the most important, but short-term results matter for semiconductors because the rapid pace of technological innovation (Moore's Law) could make yesterday's hit product obsolete today. Penguin Solutions’s performance shows it grew in the past but relinquished its gains over the last two years, as its revenue fell by 2.5% annually. 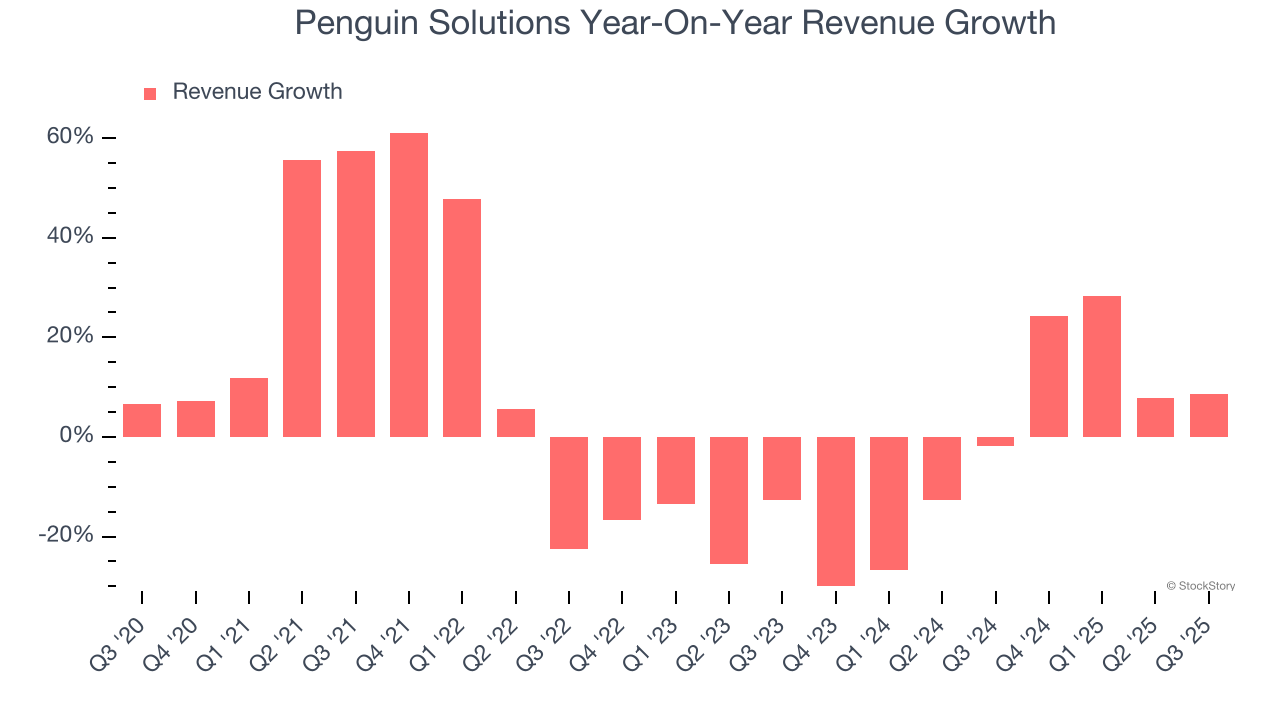
This quarter, Penguin Solutions’s revenue grew by 8.6% year on year to $337.9 million, missing Wall Street’s estimates. Beyond the miss, this marks 4 straight quarters of growth, implying that Penguin Solutions is in the middle of its cycle - a typical upcycle generally lasts 8-10 quarters.
Looking ahead, sell-side analysts expect revenue to grow 10.4% over the next 12 months. Although this projection suggests its newer products and services will spur better top-line performance, it is still below the sector average.
Today’s young investors won’t have read the timeless lessons in Gorilla Game: Picking Winners In High Technology because it was written more than 20 years ago when Microsoft and Apple were first establishing their supremacy. But if we apply the same principles, then enterprise software stocks leveraging their own generative AI capabilities may well be the Gorillas of the future. So, in that spirit, we are excited to present our Special Free Report on a profitable, fast-growing enterprise software stock that is already riding the automation wave and looking to catch the generative AI next.
Product Demand & Outstanding Inventory
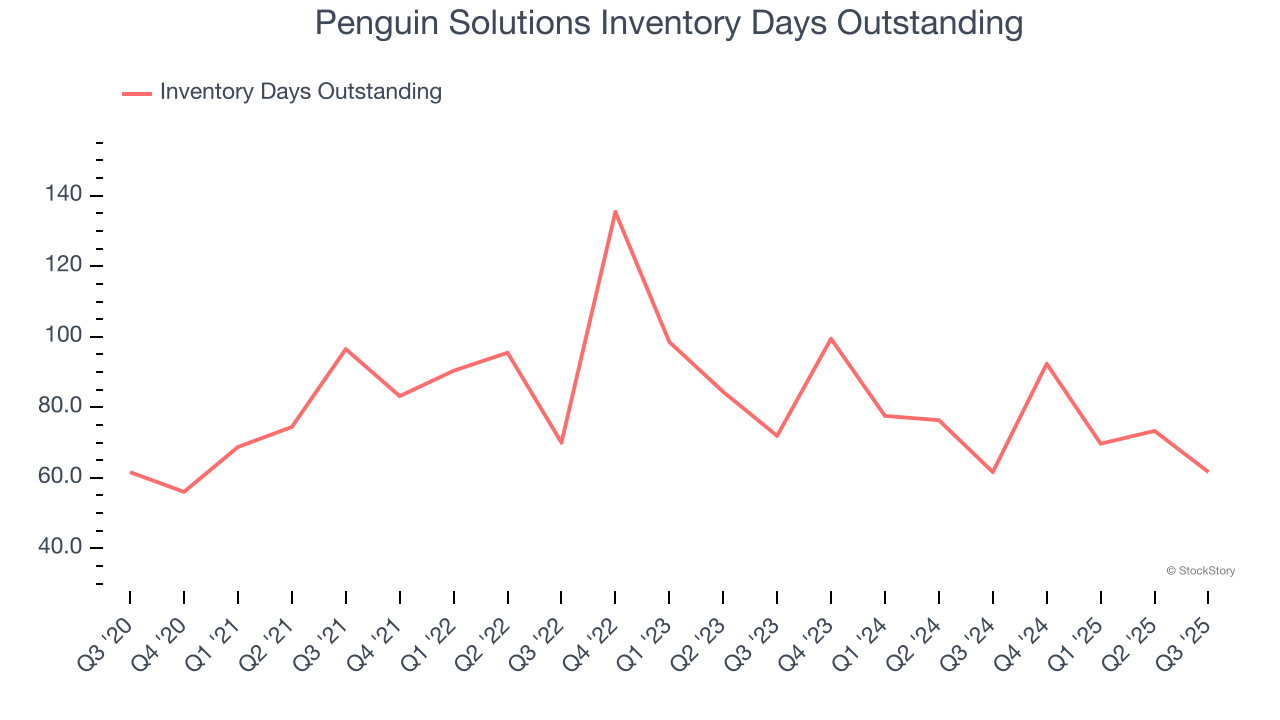
Days Inventory Outstanding (DIO) is an important metric for chipmakers, as it reflects a business’ capital intensity and the cyclical nature of semiconductor supply and demand. In a tight supply environment, inventories tend to be stable, allowing chipmakers to exert pricing power. Steadily increasing DIO can be a warning sign that demand is weak, and if inventories continue to rise, the company may have to downsize production.
This quarter, Penguin Solutions’s DIO came in at 62, which is 20 days below its five-year average. At the moment, these numbers show no indication of an excessive inventory buildup.
Key Takeaways from Penguin Solutions’s Q3 Results
We were impressed by Penguin Solutions’s adjusted operating income beat compared to Wall Street’s estimates. On the other hand, its revenue slightly missed and its EPS was just in line with Wall Street’s estimates. Looking ahead, EPS guidance also missed. Overall, this quarter could have been better, especially the financial outlook. The stock traded down 11.5% to $23.85 immediately following the results.
So should you invest in Penguin Solutions right now? The latest quarter does matter, but not nearly as much as longer-term fundamentals and valuation, when deciding if the stock is a buy. We cover that in our actionable full research report which you can read here, it’s free for active Edge members.


