
Over the last six months, Flagstar Financial’s shares have sunk to $10.95, producing a disappointing 12% loss - a stark contrast to the S&P 500’s 15.3% gain. This was partly due to its softer quarterly results and may have investors wondering how to approach the situation.
Is there a buying opportunity in Flagstar Financial, or does it present a risk to your portfolio? Dive into our full research report to see our analyst team’s opinion, it’s free for active Edge members.
Why Do We Think Flagstar Financial Will Underperform?
Despite the more favorable entry price, we're sitting this one out for now. Here are three reasons you should be careful with FLG and a stock we'd rather own.
1. Revenue Tumbling Downwards
We at StockStory place the most emphasis on long-term growth, but within financials, a stretched historical view may miss recent interest rate changes, market returns, and industry trends. Flagstar Financial’s recent performance marks a sharp pivot from its five-year trend as its revenue has shown annualized declines of 23.8% over the last two years. 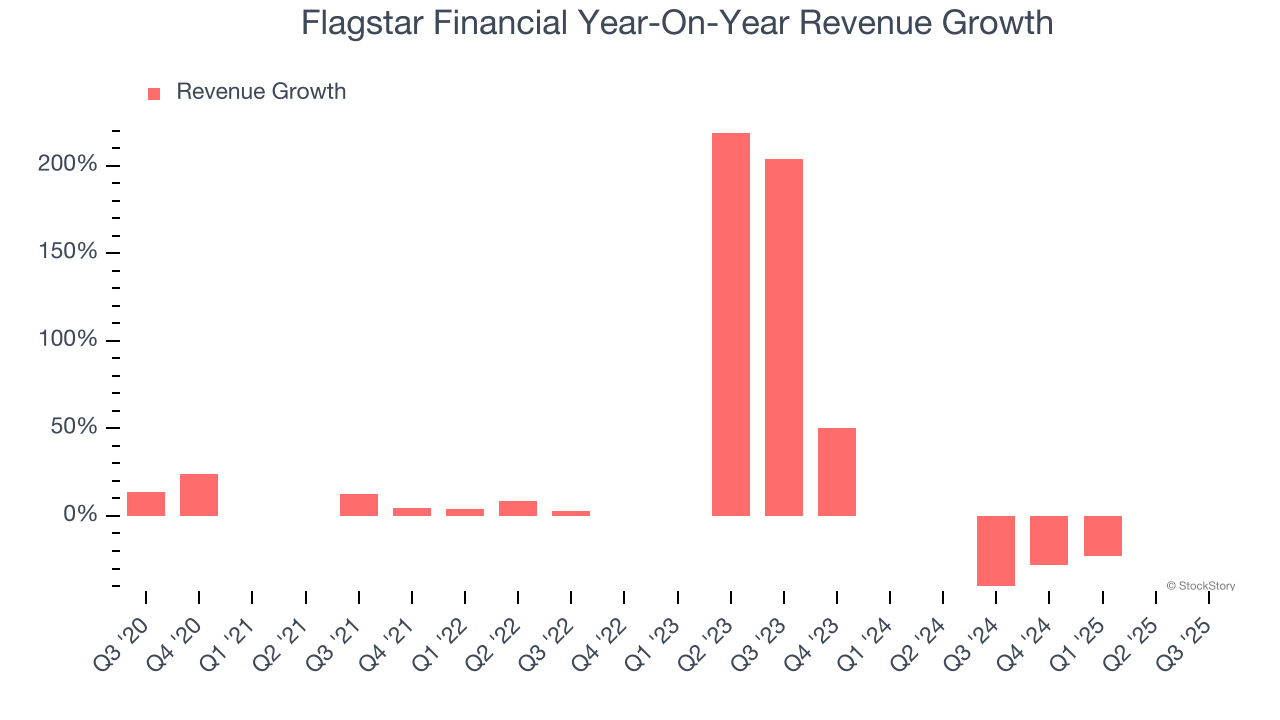 Note: Quarters not shown were determined to be outliers, impacted by outsized investment gains/losses that are not indicative of the recurring fundamentals of the business.
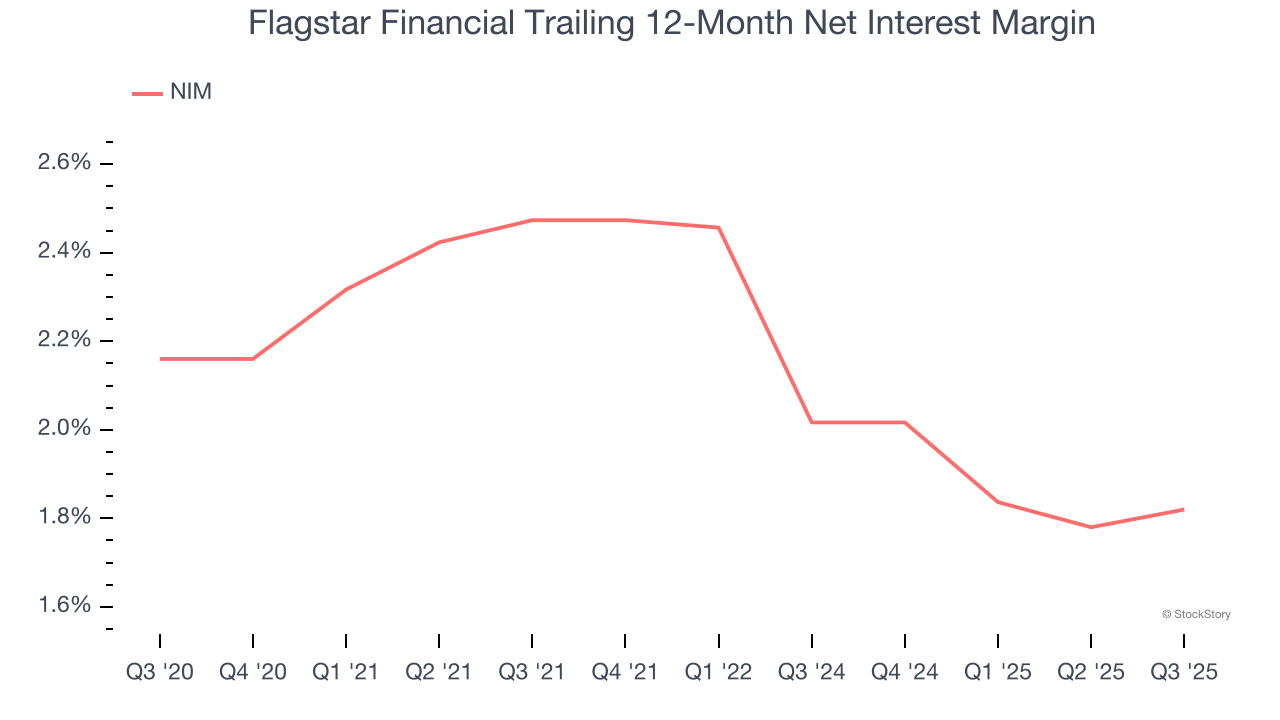
2. Low Net Interest Margin Reveals Weak Loan Book Profitability
The net interest margin (NIM) is a key profitability indicator that measures the difference between what a bank earns on its loans and what it pays on its deposits. This metric measures how efficiently one can generate income from its core lending activities.
Over the past two years, we can see that Flagstar Financial’s net interest margin averaged a poor 1.9%, reflecting its high servicing and capital costs.
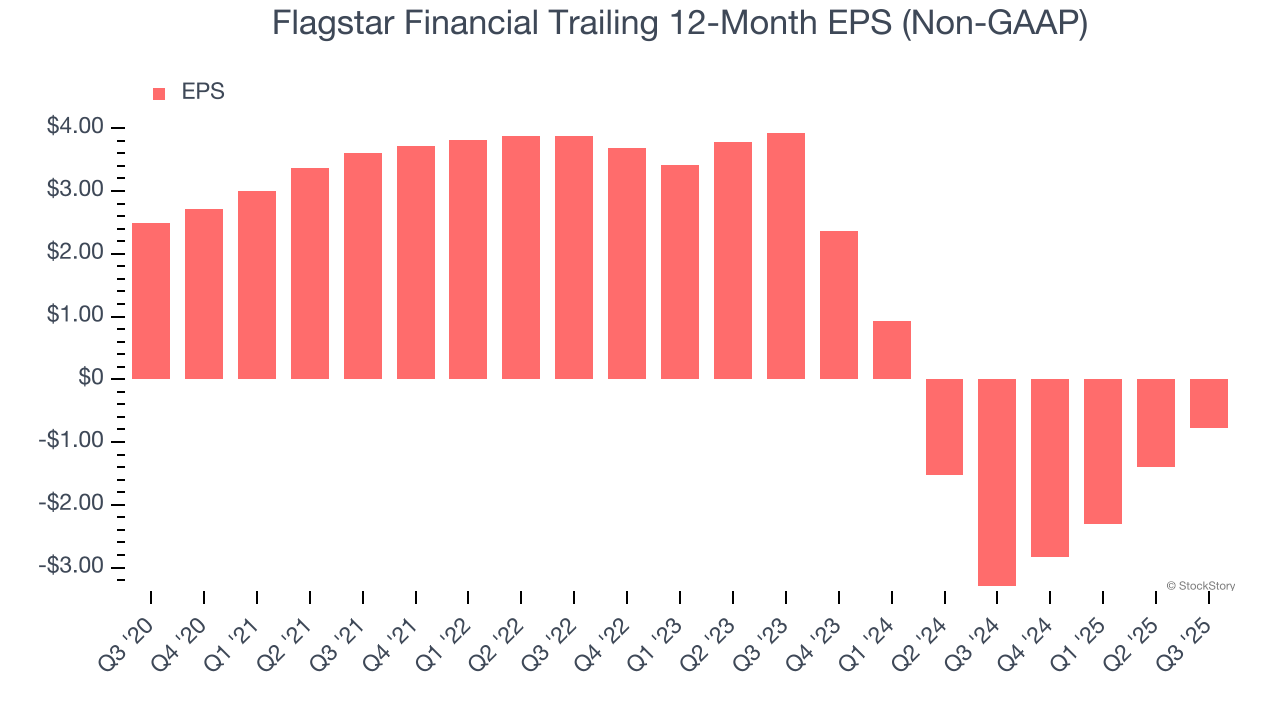
3. EPS Trending Down
We track the long-term change in earnings per share (EPS) because it highlights whether a company’s growth is profitable.
Sadly for Flagstar Financial, its EPS declined by 18.3% annually over the last five years while its revenue grew by 14.2%. This tells us the company became less profitable on a per-share basis as it expanded.
Final Judgment
Flagstar Financial doesn’t pass our quality test. After the recent drawdown, the stock trades at 0.6× forward P/B (or $10.95 per share). While this valuation is optically cheap, the potential downside is huge given its shaky fundamentals. There are better stocks to buy right now. We’d recommend looking at one of our top digital advertising picks.
Stocks We Like More Than Flagstar Financial
Donald Trump’s April 2025 "Liberation Day" tariffs sent markets into a tailspin, but stocks have since rebounded strongly, proving that knee-jerk reactions often create the best buying opportunities.
The smart money is already positioning for the next leg up. Don’t miss out on the recovery - check out our Top 9 Market-Beating Stocks. This is a curated list of our High Quality stocks that have generated a market-beating return of 183% over the last five years (as of March 31st 2025).
Stocks that made our list in 2020 include now familiar names such as Nvidia (+1,545% between March 2020 and March 2025) as well as under-the-radar businesses like the once-small-cap company Comfort Systems (+782% five-year return). Find your next big winner with StockStory today.
StockStory is growing and hiring equity analyst and marketing roles. Are you a 0 to 1 builder passionate about the markets and AI? See the open roles here.